10/11/2022 Daily Reports
- EURUSD has dropped on the day by over 0.4% in a volatile session in New York that has seen good two-way business in the forex market. The US dollar advanced on Wednesday, as results so far for the midterm elections showed little evidence of a “red wave” resounding Republican victory. The pair ended Wednesday just above 1.0000, still bullish in the daily chart.
- In US politics, a stronger showing by Republicans was expected to have fanned the flames of speculation around prospects of less fiscal support and potentially a lower peak in the Fed’s terminal rate. This initially drove an offer into the greenback and subsequently supported the Euro on Friday and at the start of the week within its trading range of 0.97-1.01 for the month so far. However, the prospect of a divided US Congress and the expected Republican Red sweep seems not to have materialized. Consequently, Wall Street opened offered and remains in the red in the latter part of the session, bearish for the Euro.
- As for positioning, the latest CFTC speculators’ positioning data have shown a sharp ramping up in the levels of net EUR longs over the past two weeks, to the highest levels since June last year. This leaves room for a correction should the US Dollar manage to catch a bid again that has retreated from multi-decade highs in recent weeks as investors take profits following a months-long rally.
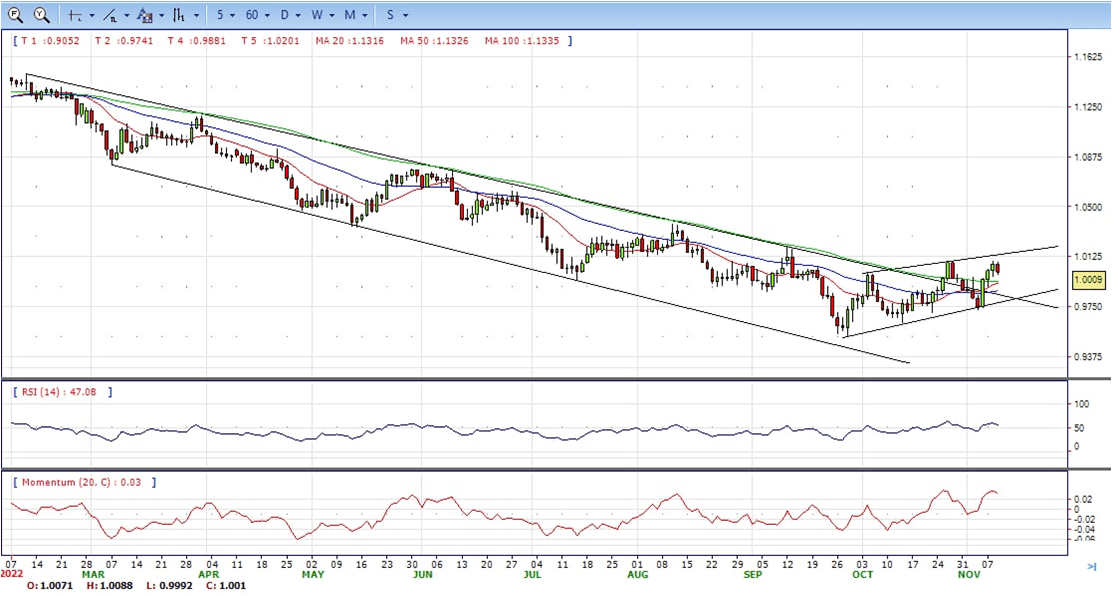
- The EUR/USD pair is trading near the 1.0010, down for the day with bullish stance in daily chart. The pair stabilized above 20 and 50 SMA, indicates bullish strength. Meanwhile, the 20 SMA started turning north and heading towards longer ones, suggests bulls not exhausted yet. On upside, the immediate resistance is 1.0100, break above this level will extend the advance to 1.0200.
- Technical readings in the daily chart support the bullish stances. The RSI indicators hovering above the midlines and stabilized around 56. The Momentum indicator stabilized above the midline, indicating upward potentials. On downside, the immediate support is 0.9970 and below this level will open the gate to 0.9900.
- The GBPUSD pair comes under heavy selling pressure on Wednesday and stalls a three-day-old bullish trend to over a one-week high touched the previous day. The intraday downfall picks up pace during the early North American session and drags spot prices to a fresh daily low, with bears now awaiting a sustained weakness below the 1.1300 mark.
- The Greenback is picking up on Wednesday, with investors reluctant to place significant bets, awaiting the outcome of the US mid-term elections and the release of US consumer inflation figures on Thursday. The latest news has shown better-than-expected results for the Democrats as the “red wave” announced by the media has not crystallized. The final results, however, might still take some time, and key issues like the control of Congress and Biden’s next year agenda are still uncertain.
- Beyond that US CPI data, due on Thursday, might provide further insight into the size of the Federal Reserve’s next interest rate hike. Any surprise in these readings might boost Dollar volatility.
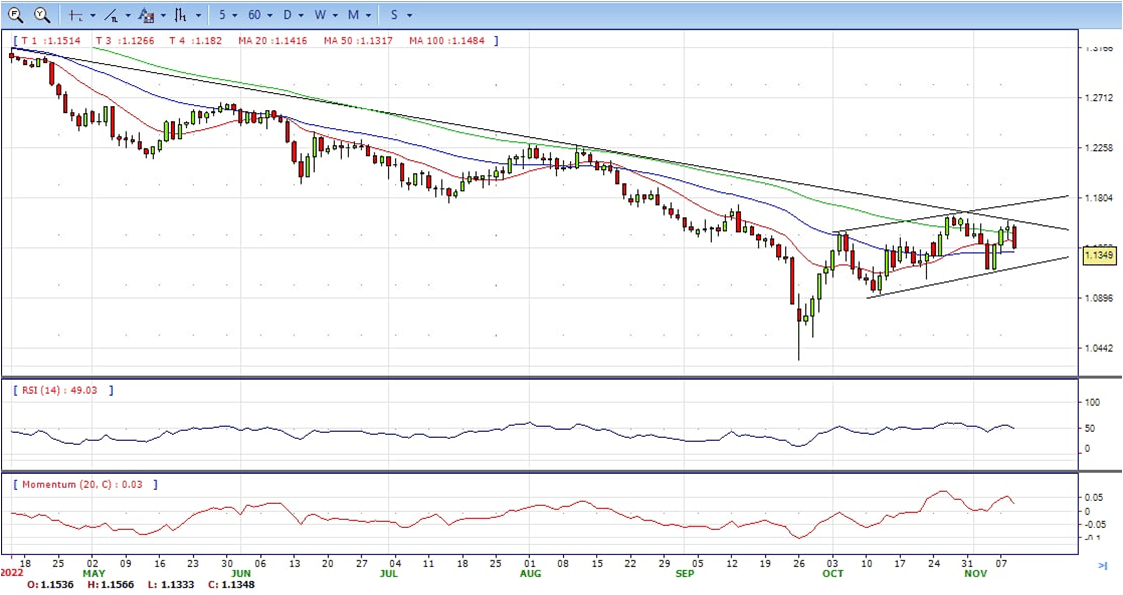
- The GBP/USD offers neutral to bullish stance in daily chart. Cable stabilized between 20 and 50 SMAs, indicating neutral strength in short term. Meanwhile, the 20 SMA started turning flat but continued developing above 50 SMA, suggests bulls not exhausted yet. On upside, The immediate resistance is 1.1440 with a break above it exposing to 1.1600.
- Technical readings in the daily chart support the neutral to bullish stances. RSI indicator stabilized around 50, while the Momentum indicator stabilized above the midline, suggesting upward potentials. On downside, the immediate support is 1.1300, unable to defend this level will resume the decline to 1.1150.


- Gold price is trading in the red, unable to crack the key resistance level at around $1716, while US Treasury yields edge higher, underpinning the American Dollar. At the time of typing, the XAUUSD is trading at $1705, still bullish in the daily chart.
- US equities are set to open lower, as shown by the futures market. A close race between the Republicans and Democrats turned sentiment sour, as polls suggest that the former might regain control of the US House while the Democrats would keep control of the US Senate. That said, the US Treasury yields rallied, led by the 10-year rising two basis points, at 4.155%, a tailwind for the precious metals space.
- Additionally, the US 10-year real yield, which is the yield of the 10-year bond minus inflation expectations for the same time horizon, sits at 1.70%, capping the Gold rally on Tuesday. Meanwhile, the US Dollar Index, a gauge of the bucks’ value vs. a basket of peers, is snapping three days of consecutive losses, up by 0.54% at 110.220.
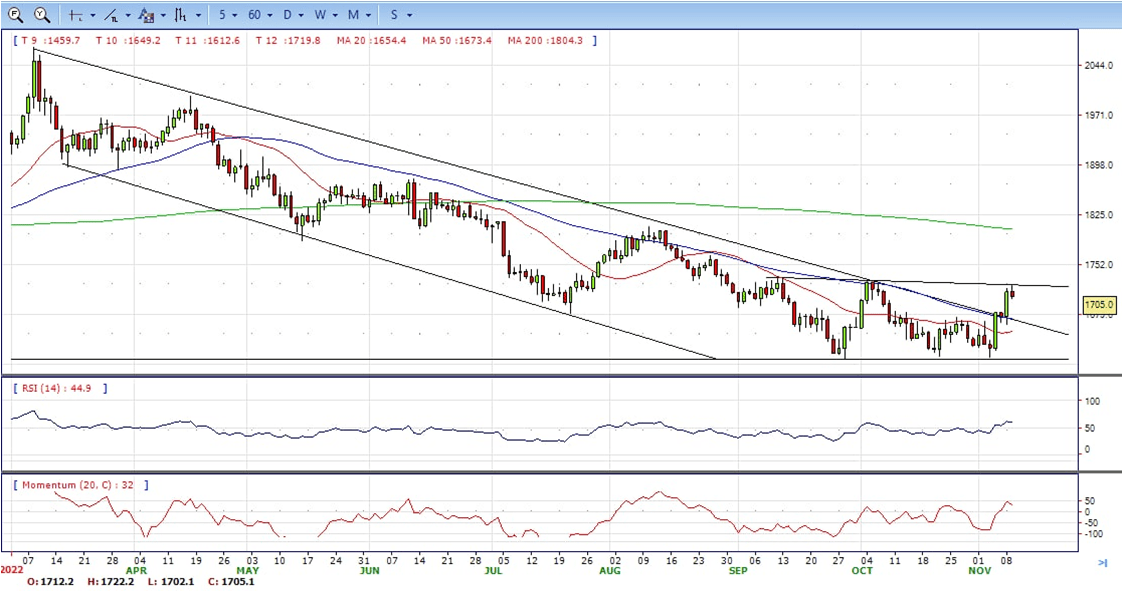
- Gold price stabilized around 1705, down for the day and bullish in the daily chart. The gold price stabilized above 20 and 50 SMA, suggesting bullish strength. Meanwhile, the 20 SMA started turning north and heading towards longer ones, indicating bulls not exhausted yet. On upside, the immediate resistance is 1717, break above this level will open the gate to extend the advance to 1730 area.
- From a technical perspective, the RSI indicator hold above the midline and stabilized around 60, suggesting bullish strength. The Momentum indicator stabilized above the midline, suggests upward potentials. On downside, the immediate support is 1665, below this area may resume the decline to 1645.


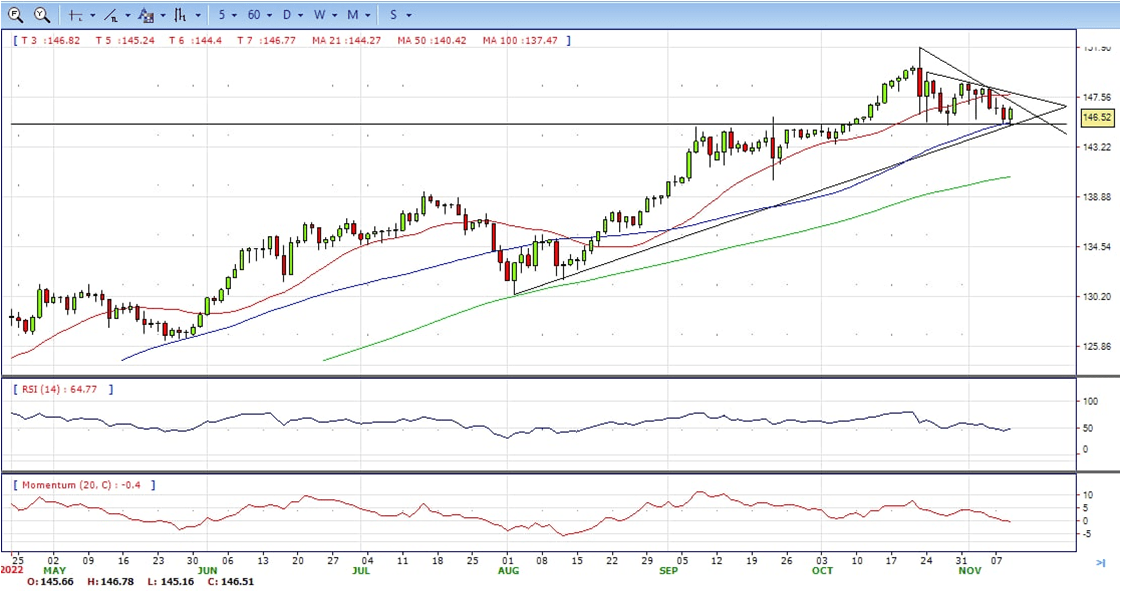
- The US Dollar’s recovery from two-week lows at the 145.15 area lost momentum at 146.55 earlier on Wednesday, before pulling back to levels right above 146.00. The pair remains moderately bid on daily charts, trimming losses after a 1.85% decline over the previous three days.
- Investors have turned cautious on Wednesday, which has favored the safe-haven US Dollar amid the uncertainty about the results of the US mid-term elections. The Republican “red wave” has not been seen, and both parties are in a tight race to decide the control of Congress and the fate of Joe Biden’s agenda for 2023.
- In the absence of key macroeconomic events, the highlights of the week will be the release of US consumer inflation data. These figures might offer some insight into the Federal Reserve’s next monetary policy decision which could generate significant Dollar volatility.
- The USD/JPY pair stabilized around 146.50, up for the day and neutral in the daily chart. The price still maintains the upward slope but stabilized between 20 and 50 SMA, suggests neutral strength in short term. Meanwhile, 20 SMA continued developing north and far above longer ones, indicating bulls not exhausted. On upside, overcome 147.00 may encourage bulls to challenge 148.00, break above that level will open the gate to 149.00.
- Technical indicators suggest the neutral strength. RSI stabilized around 50, while the Momentum indicator continued developing near the midline, suggests directionless potentials. On downside, the immediate support is 145.00 (50 SMA), break below this level will open the gate to 143.50 area.
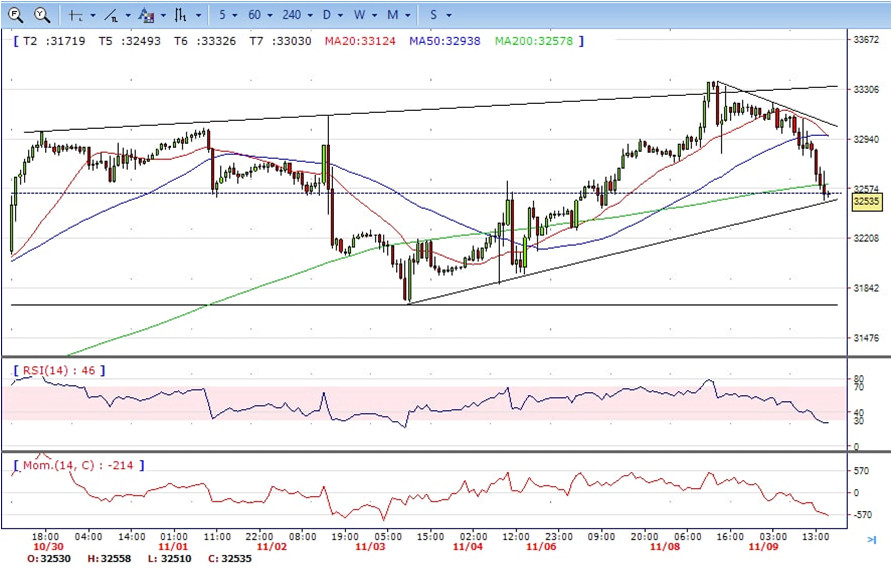
- DJI under the strong sell pressure, retreated from intraday low 33200 area to 32486 daily low. It hold near the bottom and ended Wednesday at around 32530, down for the day and bearish in the hourly chart. The price stabilized below all main SMAs, suggests bearish strength. Meanwhile, 20 SMA continued accelerating south and heading towards longer ones, suggests bears not exhausted yet. On upside, overcome 32760 may encourage bulls to challenge 33000, break above this level will open the gate to 33360.
- Technical indicators suggest the bearish strength. RSI stabilized around 26, while the Momentum indicator stabilized below the midline, suggests downward potentials. On downside, the immediate support is 32450, break below this level will open the gate for more decline to 32250 area.
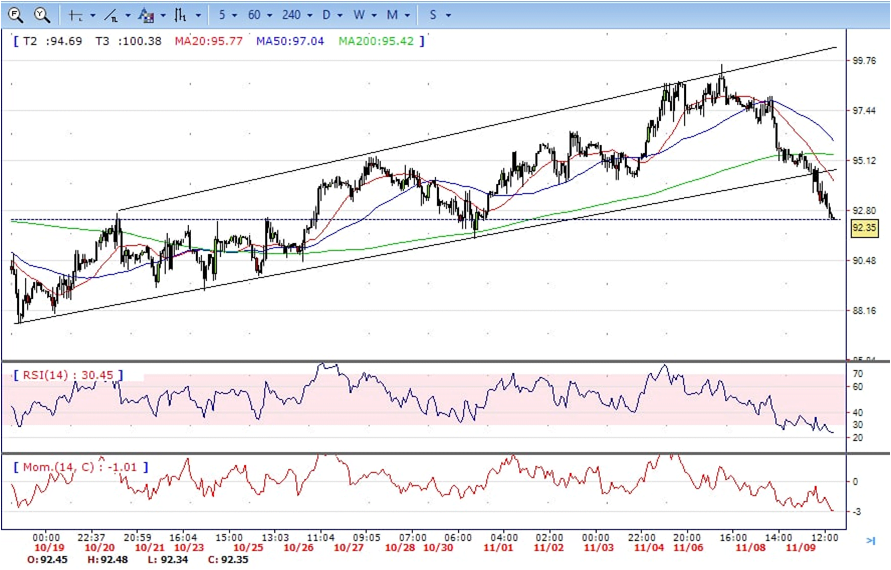
- Brent still under the strong sell pressure, dropped from intraday high 95.60 area to intraday low 92.35, it hold near the bottom to ended Wednesday, down for the day and bearish in the hourly chart. The price stabilized below all main SMAs, suggests bearish strength in short term. Meanwhile, the 20 SMA continued accelerating south and developing below longer ones, indicating bears not exhausted yet. On upside, overcome 94.20 may encourage bulls to challenge 95.60, break above this level will open the gate to 97.00.
- Technical indicators suggest the bearish movement, hovering below the midline. RSI stabilized at around 24, while the Momentum indicator stabilized in negative territory, suggests downward potentials. On downside, the immediate support is 91.50, break below this level will open the gate for more decline to 90.40 area.