10/05/2023 Daily Reports
- The EUR/USD extends its losses on Tuesday past the 1.10 handle, briefly testing last week’s low of 1.0942, but bounced off that price level, above the 1.0950 area. Worries about the US debt ceiling, and a strong US Dollar, weakened the prospects for a higher Euro. At the time of writing, the EUR/USD is trading at 1.0965, down 0.4%.
- Wall Street is posting losses after the Fed’s Senior Loan Officer Opinion Survey showed that credit conditions are tightening, thought “not as disastrous as many doomsayers had feared,” wrote analysts at Brown Brothers Harriman. Discussions around the US debt ceiling could heat on Tuesday, as US President Joe Biden will meet with Republicans and Democrats to lay the ground around the theme.
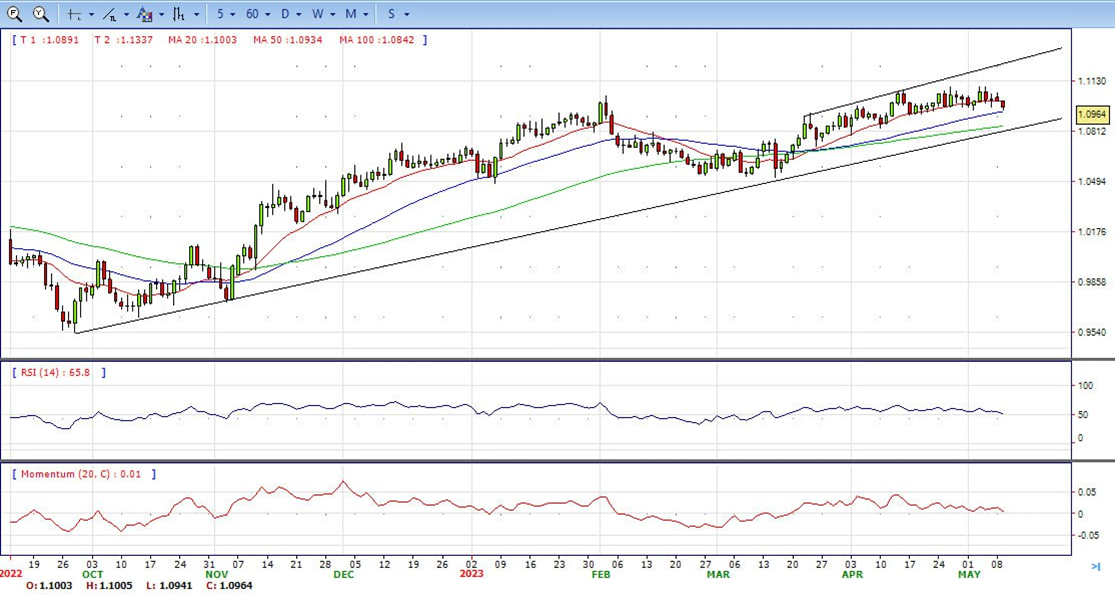
- The EUR/USD pair is trading near the 1.0965, down for the day with neutral to bullish stance in daily chart. The pair stabilized between 20 and 50 SMA, indicates neutral strength. Meanwhile, the 20 SMA continued developing above 50 and 200 SMA, suggests bulls not exhausted yet. On upside, the immediate resistance is 1.1100, break above this level will extend the advance to 1.1180.
- Technical readings in the daily chart support the neutral stance. The RSI indicator stabilizes around 51. The Momentum indicator holds just above the midline, indicating modest bullish potentials. On downside, the immediate support is 1.0910 and below this level will open the gate to 1.0830.
- The Pound Sterling recovers back above the 1.2600 handle versus the US Dollar on Tuesday, as the Greenback slips on the back of slightly softer US Treasury bond yields.
- In fact, the Greenback extends the promising start of the week and keeps the risk complex under pressure against the backdrop of easing concerns over the US banking sector, particularly following the Fed’s Senior Loan Officer Survey late on Monday. In the UK calendar, April releases saw the BRC Retail Sales Monitor increase 5.2% from a year earlier, while the House Price Index measured by Halifax contracted 0.3% MoM and rose 0.1% over the last twelve months. Finally, BBA Mortgage Rate ticked higher to 7.41% (from 7.22%).
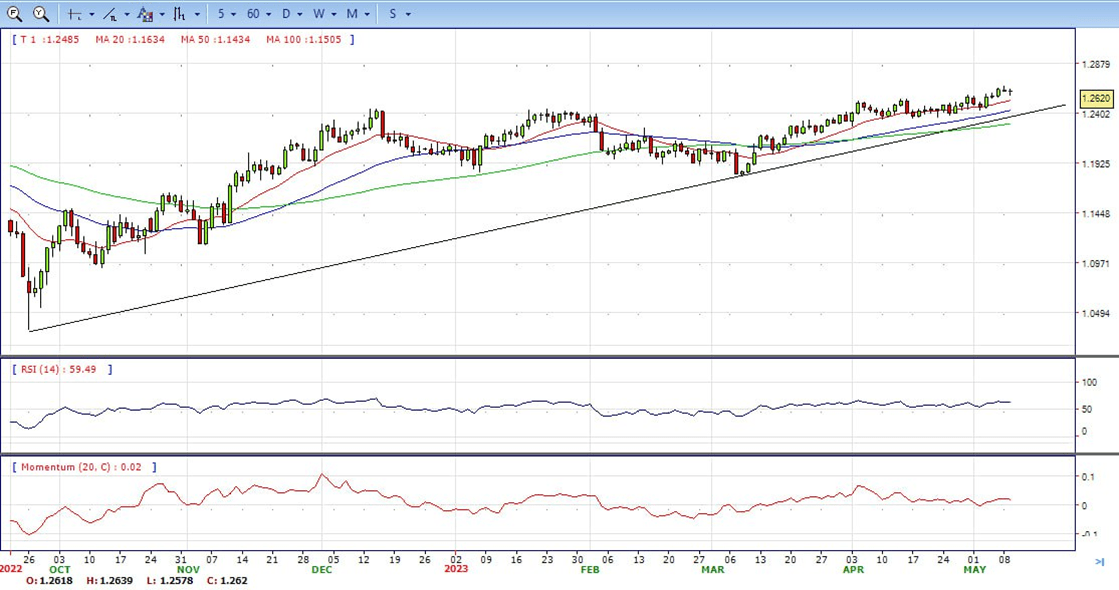
- The GBP/USD offers bullish stance in daily chart. Cable stabilizes above 20 and 50 SMA, indicating bullish strength in short term. Meanwhile, the 20 SMA continued accelerating north and developing far above longer ones, suggests bulls not exhausted yet. On upside, the immediate resistance is 1.2670 with a break above it exposing to 1.2800.
- Technical readings in the daily chart support the bullish stances. RSI indicator stabilizes around 63, while the Momentum indicator stabilizes above the midline, suggesting upward potentials. On downside, the immediate support is 1.2540, unable to defend this level will resume the decline to 1.2430.


- Gold price is printing back-to-back bullish days as the XAU/USD meanders nearby Monday’s high of $2029, bolstered by falling US Treasury bond yields despite a strong US Dollar. The XAU/USD is underpinned by uncertainty around the US debt ceiling and a US inflation report looming. At the time of writing, the XAU/USD is trading at $2034, above its opening price by 0.64%.
- The negative tone is being reflected by Wall Street registering losses. Worries about politics, namely the debt ceiling, weighed on market sentiment. Credit conditions in the United States began to tighten, as shown by the Fed’s Senior Loan Officer Opinion Survey, though “not as disastrous as many doomsayers had feared,” Analysts at Brown Brothers Harriman noted.
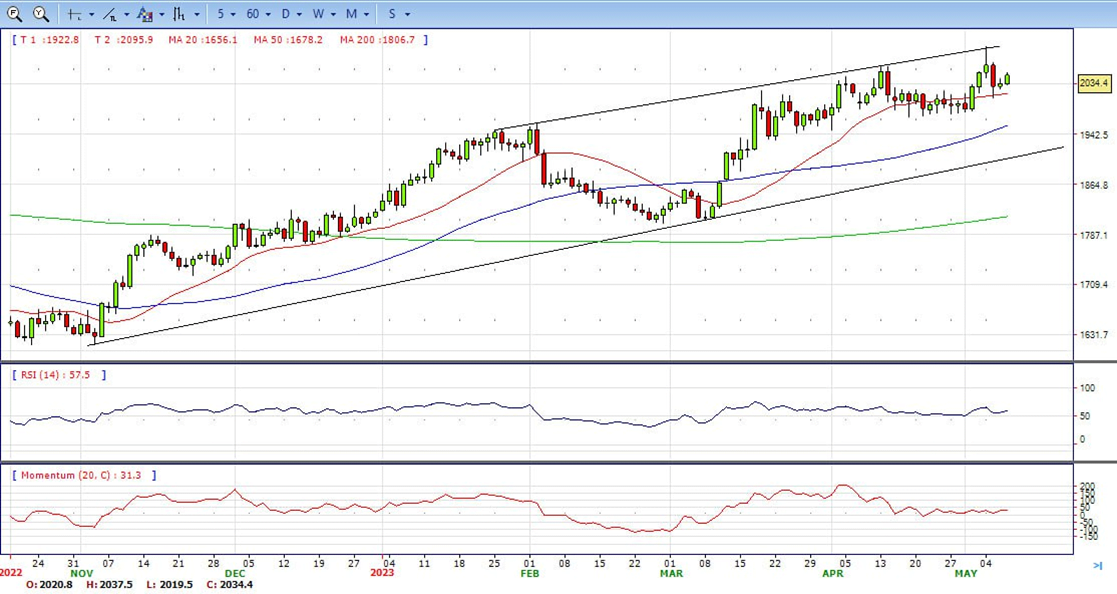
- Gold price stabilized around 2034, up for the day and bullish in the daily chart. The gold price stabilizes above 20 SMA, suggesting bullish strength in short term. Meanwhile, the 20 SMA started turning flat but continued developing far above 50 and 200 SMA, indicates bulls not exhausted yet. On upside, the immediate resistance is 2038, break above this level will open the gate for more advance to 2060 area.
- From a technical perspective, the RSI indicator holds above the mid-line and stabilizes around 59, on a bullish strength. The Momentum indicator hold above the midline, suggests upward potentials. On downside, the immediate support is 2000, below this area may resume the decline to 1970.


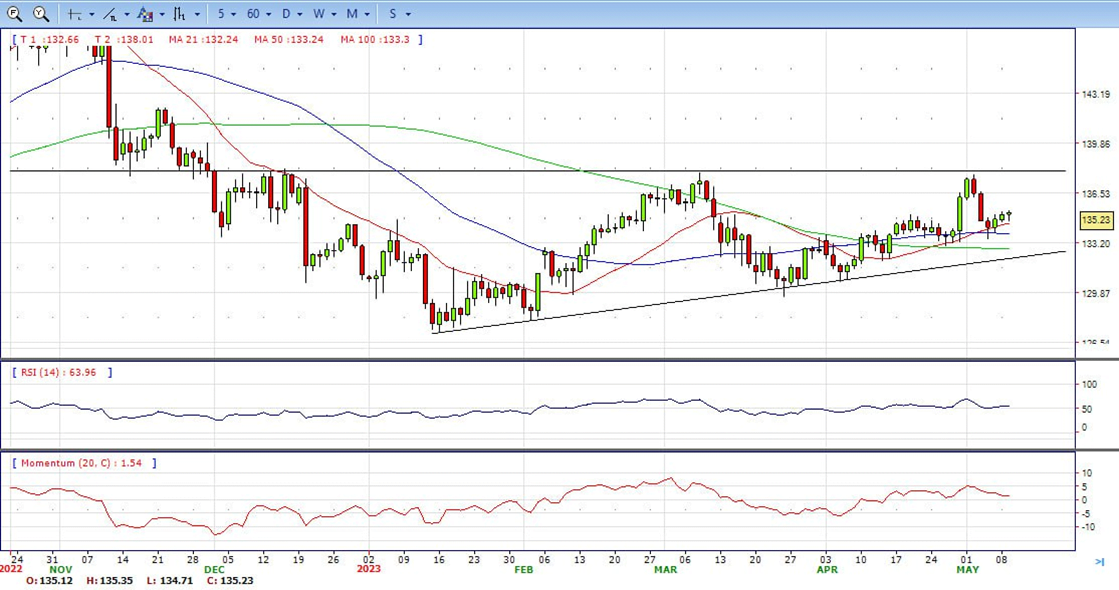
- The USD/JPY pair retreats from a four-day high, around the 135.35 region touched earlier this Tuesday and extends its steady intraday descent through the first half of the European session. Spot prices, however, rebound a few pips and now trade with only mild intraday gains, just around the 135.20 psychological mark.
- The Japanese Yen gets a minor lift in reaction to hawkish-sounding remarks by the Bank of Japan Governor Kazuo Ueda, which, in turn, exerts some downward pressure on the USD/JPY pair. Speaking in parliament, Ueda said Japan’s economy was picking up and inflation expectations remain at high levels. He added that the central bank will end its yield curve control policy and then start shrinking its balance sheet, once prospects heighten for inflation to sustainably hit its 2% target.
- The USD/JPY pair stabilized around 135.20, slightly up for the day and bullish in the daily chart. The price stabilizes above 20 and 50 SMA, suggests bullish strength in short term. Meanwhile, 20 SMA started turning north but continued developing above longer ones, indicating bulls not exhausted. On upside, overcome 135.70 may encourage bulls to challenge 136.70, break above that level will open the gate to 137.90.
- Technical indicators suggest the neutral to bullish strength. RSI stabilizes around 55, while the Momentum indicator stabilizes above the midline, suggests upward potentials. On downside, the immediate support is 134.60, break below this level will open the gate to 133.50 area.
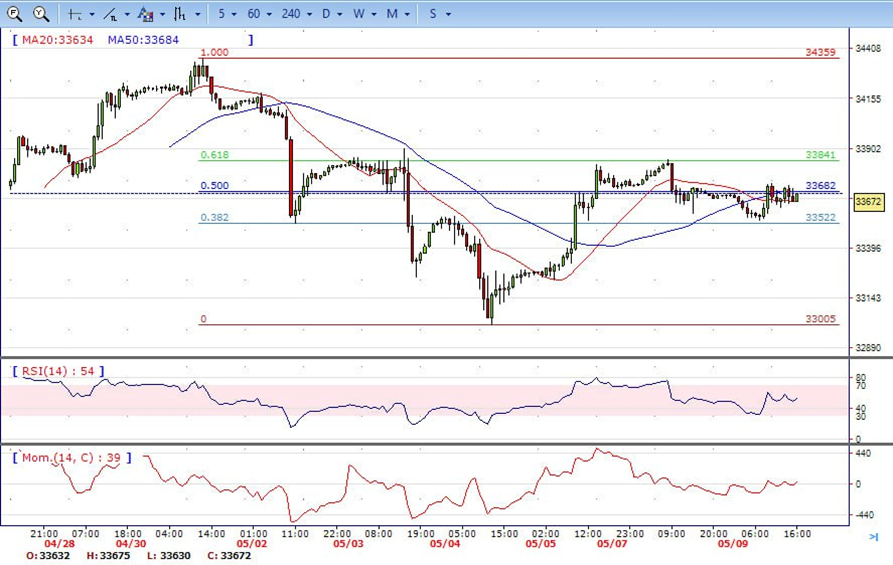
- DJI fluctuated in the familiar range on Tuesday, traded between intraday low 33537 area to high 33725 level and ended the day around 33670. Right now market is standing between 20 and 50 SMA, suggests neutral strength. Meanwhile, 20 and 50 SMA started turning flat and continued developing below 200 SMA, suggests bears not exhausted yet. On upside, overcome 33900 may encourage bulls to challenge 34180, break above that level will open the gate to 34360.
- Technical indicators suggest the bullish movement. RSI stabilizes around 54, while the Momentum indicator stabilizes near the midline, suggests directionless potentials. On downside, the immediately support is 33530, break below this level will open the gate for more decline to 32300 area.
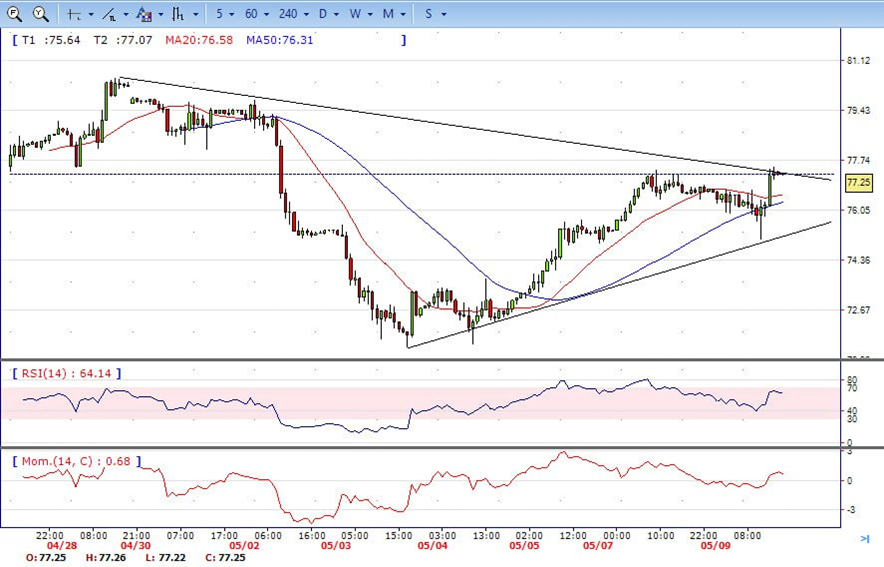
- Brent rallied on the late of Tuesday, climbed from intraday low 75.08 area to high 77.50 level. It retreated modestly and ended the day around 77.20, indicates bullish sign in the hourly chart. Meanwhile, the 20 SMA continued accelerating north and developing above longer ones, indicates bulls not exhausted yet. On upside, overcome 77.50 may encourage bulls to challenge 79.20, break above that level will open the gate to 80.60.
- Technical indicators also suggest bullish movement, hovering above the midline. RSI stabilizes at 63, while the Momentum indicator stabilizes in positive territory, suggests upward potentials. On downside, the immediately support is 75.00, break below this level will open the gate for more decline to 73.40 area.