09/05/2023 Daily Reports
- The EUR/USD retreated from daily highs, hitting 1.1053 as the European session ended. The latest week, we have witnessed the US Fed and the ECB increasing rates by 25 bps, though divergence would likely favour the latter. Hence, the EUR/USD is trading at 1.1004, with losses of 0.07%.
- US equities continued to trade mixed. The EUR/USD pair is clinging to its earlier gains, despite data from the EU, namely Germany, showing that Industrial Production plunged in March to -3.4%, below the -1.3% contraction expected by the consensus. That, alongside the last week, Germany’s Industrial Orders plummeting 10.7% MoM, has raised recessionary fears amongst the EU.
- The EUR/USD pair is trading near the 1.1004, slightly down for the day with bullish stance in daily chart. The pair stabilized above 20 and 50 SMA, indicates bullish strength. Meanwhile, the 20 SMA continued developing above 50 and 200 SMA, suggests bulls not exhausted yet. On upside, the immediate resistance is 1.1100, break above this level will extend the advance to 1.1180.
- Technical readings in the daily chart support the bullish stance. The RSI indicator stabilizes around 55. The Momentum indicator holds above the midline, indicating bullish potentials. On downside, the immediate support is 1.0910 and below this level will open the gate to 1.0830.

- The GBP/USD retreats after hitting a new YTD high of 1.2668 after the US Fed reported the Senior Loan Officer Opinion Survey, which showed that US banks are expecting tightening credit conditions. However, a looming BoE monetary policy cushioned the Pound Sterling. At the time of writing, the GBP/USD is trading at 1.2615.
- The GBP/USD slid after the report crossed the screens, from around 1.2640 to current exchange rates, as the greenback recovered some ground. The US Dollar Index, which tracks the performance of six currencies vs. the American Dollar, rises 0.15%, at 101.370. Meanwhile, US Treasury bond yields continued to gain ground, with the 10-year benchmark note rate at 3.520%, up seven and a half bps, undermining the GBP/USD.
- The GBP/USD offers bullish stance in daily chart. Cable stabilizes above 20 and 50 SMA, indicating bullish strength in short term. Meanwhile, the 20 SMA continued accelerating north and developing far above longer ones, suggests bulls not exhausted yet. On upside, the immediate resistance is 1.2670 with a break above it exposing to 1.2800.
- Technical readings in the daily chart support the bullish stances. RSI indicator stabilizes around 63, while the Momentum indicator stabilizes above the midline, suggesting upward potentials. On downside, the immediate support is 1.2540, unable to defend this level will resume the decline to 1.2430.


- Gold price regains some positive traction on the first day of a new week and builds on Friday’s late bounce from levels just below the $2,000 psychological mark. The XAU/USD sticks to its gains through the first half of the US session and is currently placed for the day on Monday, around the $2,020 region.
- The US Dollar edges lower for the second successive day and remains well within the striking distance of the monthly low touched last week, which, in turn, is seen benefitting Gold price. Despite the mostly upbeat release of the jobs report from the US on Friday, market participants seem convinced that the Fed is nearing the end of its rate-hiking cycle. In fact, the Fed Fund futures point to a 90% probability that the US central bank will hold rates in June. Moreover, the markets have been pricing in the possibility that the Fed will cut rates in the second half of this year amid signs that the economy is slowing. This, in turn, continues to weigh on the Greenback and lends some support to the US Dollar-denominated commodity.
- Gold price stabilized around 2020, up for the day and bullish in the daily chart. The gold price stabilizes above 20 SMA, suggesting bullish strength in short term. Meanwhile, the 20 SMA started turning flat but continued developing far above 50 and 200 SMA, indicates bulls not exhausted yet. On upside, the immediate resistance is 2030, break above this level will open the gate for more advance to 2060 area.
- From a technical perspective, the RSI indicator holds above the mid-line and stabilizes around 56, on a bullish strength. The Momentum indicator hold above the midline, suggests upward potentials. On downside, the immediate support is 2000, below this area may resume the decline to 1970.


- The USD/JPY pair builds on Friday’s positive move and gains some follow-through traction on the first day of a new week, albeit lacks follow-through buying. Spot prices retreat a few pips from a three-day top and trade around the 135.00 psychological mark during the late part of the US session.
- The minutes of the last BoJ policy meeting held on March 9-10 showed that members supported the continuation of policy easing in order to achieve steady inflation. Apart from this, a generally positive risk tone undermines the safe-haven JPY and acts as a tailwind for the USD/JPY pair. Some BoJ policymakers, meanwhile, saw positive signs towards achieving the price target and said that the central bank must be vigilant to the risk of inflation accelerating more than expected. This, along with a modest USD keeps a lid on any meaningful upside for the major, at least for the time being.
- The USD/JPY pair stabilized around 135.10, up for the day and bullish in the daily chart. The price stabilizes above 20 and 50 SMA, suggests bullish strength in short term. Meanwhile, 20 SMA started turning north but continued developing above longer ones, indicating bulls not exhausted. On upside, overcome 135.70 may encourage bulls to challenge 136.70, break above that level will open the gate to 137.90.
- Technical indicators suggest the neutral to bullish strength. RSI stabilizes around 54, while the Momentum indicator stabilizes above the midline, suggests upward potentials. On downside, the immediate support is 134.60, break below this level will open the gate to 133.50 area.

- DJI fluctuated in the familiar range on Monday, traded between intraday low 33567 area to high 33847 level and ended the day around 33680. Right now market is standing between 20 and 50 SMA, suggests neutral strength. Meanwhile, 20 SMA started turning flat but continued developing 50 SMA, suggests bulls not exhausted yet. On upside, overcome 33900 may encourage bulls to challenge 34180, break above that level will open the gate to 34360.
- Technical indicators suggest the neutral movement. RSI stabilizes around 52, while the Momentum indicator stabilizes below the midline, suggests downward potentials. On downside, the immediately support is 33530, break below this level will open the gate for more decline to 32300 area.

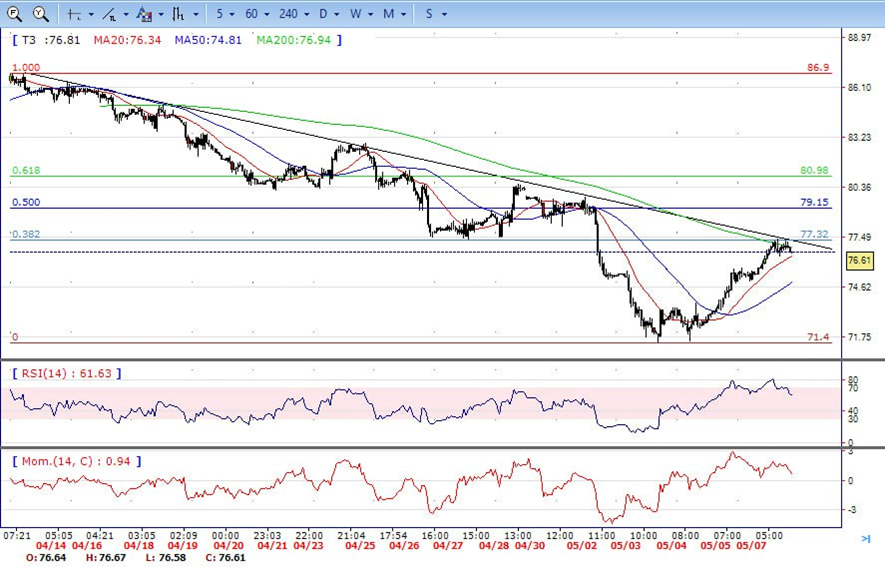
- Brent continued the advance on Monday, climbed from intraday low 74.90 area to high 77.40 level. It retreated modestly and ended the day around 76.60, indicates bullish sign in the hourly chart. Meanwhile, the 20 SMA continued accelerating north and heading towards longer ones, indicates bulls not exhausted yet. On upside, overcome 77.40 may encourage bulls to challenge 79.20, break above that level will open the gate to 80.60.
- Technical indicators also suggest bullish movement, hovering above the midline. RSI stabilizes at 61, while the Momentum indicator stabilizes in positive territory, suggests upward potentials. On downside, the immediately support is 74.90, break below this level will open the gate for more decline to 73.40 area.