06/10/2022 Daily Reports
- The EUR/USD is erasing some of Tuesday’s gains as speculations of a Fed pivot towards a dovish stance faded, as shown by US T-bond yields rising again. the EUR/USD is trading at 0.9890 after hitting a daily high close to parity.
- Sentiment deteriorated, as previously mentioned, as a possible Fed pivot faded. US economic data revealed during the day showed that private payrolls increased by 208K, as depicted by the ADP National Employment for September. Later in the day, economic activity in the Services sector showed mixed readings, though the ISM flashed that the economy is still expanding at a slower pace.
- The S&P Global Services and Composite PMIs came at 49.3 and 49.5, respectively. Nevertheless, the ISM Non-Manufacturing PMI dived to 56.7, less than August’s 56.9 but exceeded estimations of 56.0. Given the backdrop, the US economy stayed resilient amidst an aggressive tightening cycle by the US Federal Reserve, therefore bolstering the greenback.
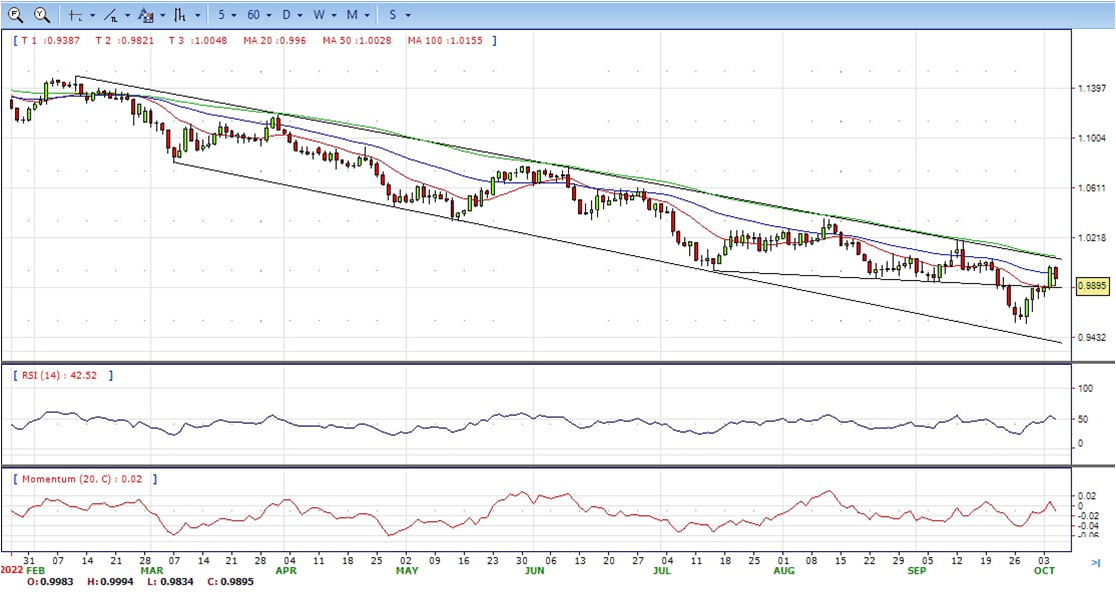
- The EUR/USD pair is trading near the 0.9890, down for the day with the neutral stance in daily chart. The pair stabilized between 20 and 50 SMA, indicates neutral strength. Meanwhile, the 20 SMA continued developing far below longer ones despite it started turning flat, suggests bears not exhausted yet. On upside, the immediate resistance is 1.0000, break above this level will extend the advance to 1.0050.
- Technical readings in the daily chart support the neutral stances. The RSI indicators hovering near the midlines and stabilized around 48. The Momentum indicator struggled near the midline, indicating directionless potentials. On downside, the immediate support is 0.9830 and below this level will open the gate to 0.9750.
- The GBP/USD is trading at the lowest level in two days around 1.1230, after falling more than 270 pips from the intraday high. Earlier the pair peaked at 1.1496, the highest level since September 15.
- The pound was already trading with some weakness that started around UK PM Liz Truss’s speech. She spoke at the Conservative Party conference defending his plan. She said that cutting taxes was the “right thing to do “morally and economically”. Truss mentioned that it is correct that the Bank of England sets interest rates independently. His words did not bring support for the pound.
- Economic data from the US came in better-than-expected on Wednesday helping the US Dollar rise across the board. Private sector employment rose by 208K in September according to ADP, above the market expectation of 200K. ISM Services PMI came in at 56.7, above the expected 56; the Employment Index rose unexpectedly to 53 from 50.2. On Friday, the US official employment report is due.
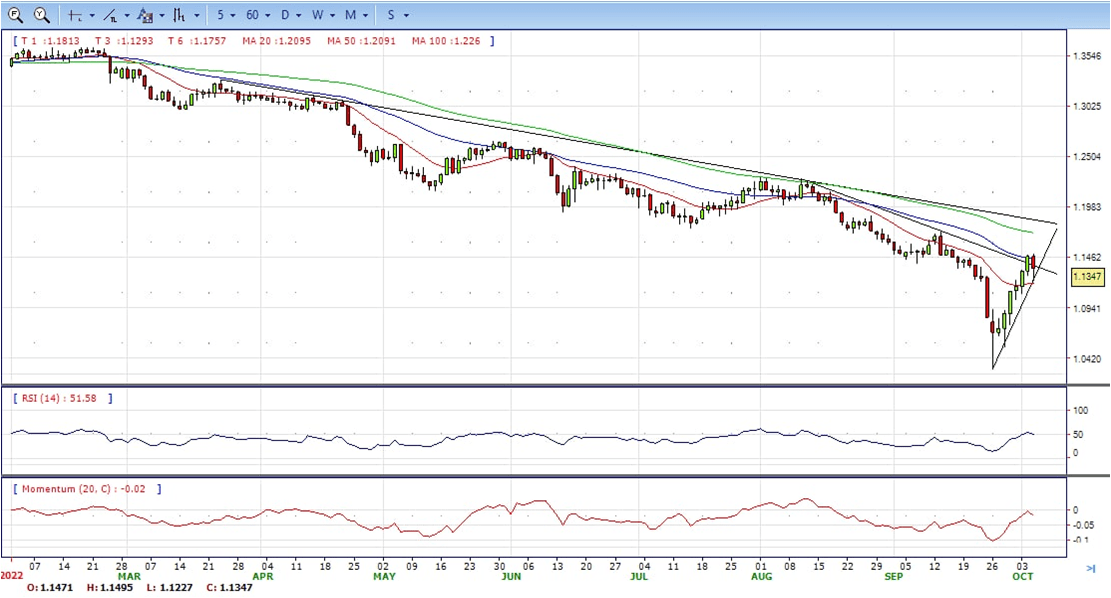
- The GBP/USD offers neutral to bearish stance in daily chart, it maintains the upward slope after hit 1.0227 low. Cable now is stabilizing between 20 and 50 SMA, indicating neutral strength in short term. Meanwhile, the 20 SMA continued developing below longer ones despite it started turning flat, suggesting bears not exhausted yet. On upside, The immediate resistance is 1.1500 with a break above it exposing to 1.1600.
- Technical readings in the daily chart neutral to bearish stances. RSI indicator stabilized around 48, while the Momentum indicator stabilized below the midline, suggesting downward potentials. On downside, the immediate support is 1.1230, unable to defend this level will resume the decline to 1.1100.

- Gold came under renewed bearish pressure and dropped toward $1,700 during the American trading hours on Wednesday. It then recovered some losses and ended the day around $1,717, bullish in the daily chart.
- The impressive rebound witnessed in US Treasury bond yields amid hawkish Fed bets weighs heavily on the precious metal mid-week. Following the sharp decline seen earlier in the week, the benchmark 10-year US Treasury bond yield is up more than 4% on a daily basis at 3.78%. According to the CME Group FedWatch Tool, markets are pricing in a 68% probability of a 75 basis points rate hike in November.
- Additionally, the ISM Services PMI came in at 56.7, showing that the business activity in the service sector continued to expand at a healthy pace in September. More importantly, the Employment Index of the PMI survey recovered to 53 from 50.2, reviving expectations for another strong Nonfarm Payrolls report on Friday. The US Dollar Index is up 1.33% on the day, reflecting the positive impact of Wednesday’s data on the dollar’s valuation.
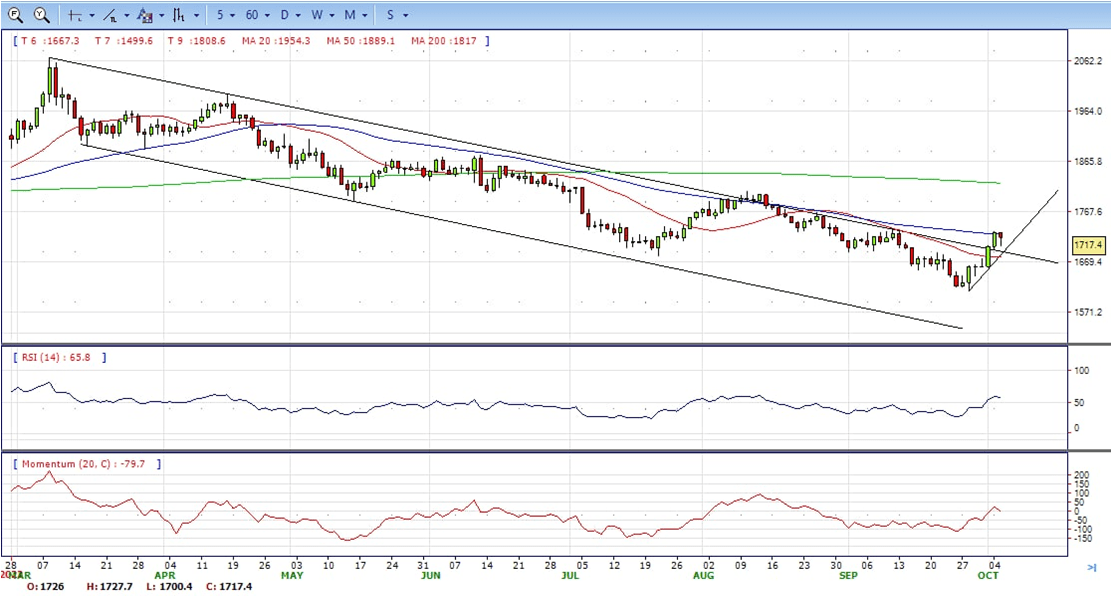
- Gold price stabilized around 1717, down for the day and bullish in the daily chart. The gold price stabilized above 20 SMA and now is challenging 50 SMA, suggesting bullish strength. Meanwhile, the 20 SMA continued developing far below longer ones despite it started turning flat, indicating bears not exhausted yet. On upside, the immediate resistance is 1730, break above this level will open the gate to extend the advance to 1745 area.
- From a technical perspective, the RSI indicator hold above the midline and stabilized around 58, suggesting bullish strength. The Momentum indicator struggled above the midline, suggests upward potentials. On downside, the immediate support is 1700, below this area may resume the decline to 1680.


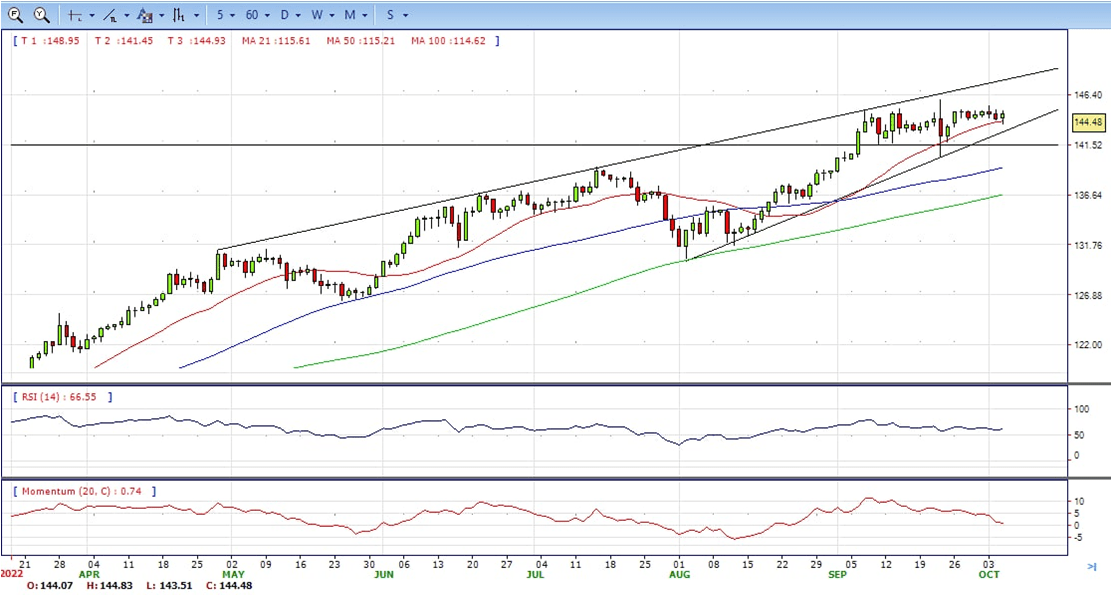
- The USD/JPY rose further during the American session and following US economic data. The pair peaked at 144.84, hitting a fresh daily high and ended Wednesday around 144.50, still bullish in the daily chart.
- Better-than-expected economic data from the US on Wednesday helped the greenback. Private jobs rose by 208K in September according to ADP, above market expectations of 200K. ISM Services PMI came in at 56.7, above the expected 56 with the Employment Index rising unexpectedly from 50.2 to 53. On Friday, the US official employment report is due; market consensus is for an increase in payroll by 250K.
- Higher US yields supported the move to the upside in USD/JPY. The US 10-year rose from 3.62% to 3.78% while the 2-year hit 4.20%. More recently, an improvement in risk sentiment added support to the pair. US stocks move off lows, trimming losses.
- The USD/JPY pair stabilized around 144.50, up for the day and bullish in the daily chart. The price still maintains the upward slope and stabilized above all main SMAs, suggests bullish strength. Meanwhile, 20 SMA continued accelerating north and developing above longer ones, indicating bulls not exhausted in the long term. On upside, overcome 145.00 may encourage bulls to challenge 146.00, break above that level will open the gate to 147.00.
- Technical indicators suggest the bullish strength. RSI stabilized around 60, while the Momentum indicator continued developing above the midline, suggests upward potentials. On downside, the immediate support is 143.00, break below this level will open the gate to 140.30 area.


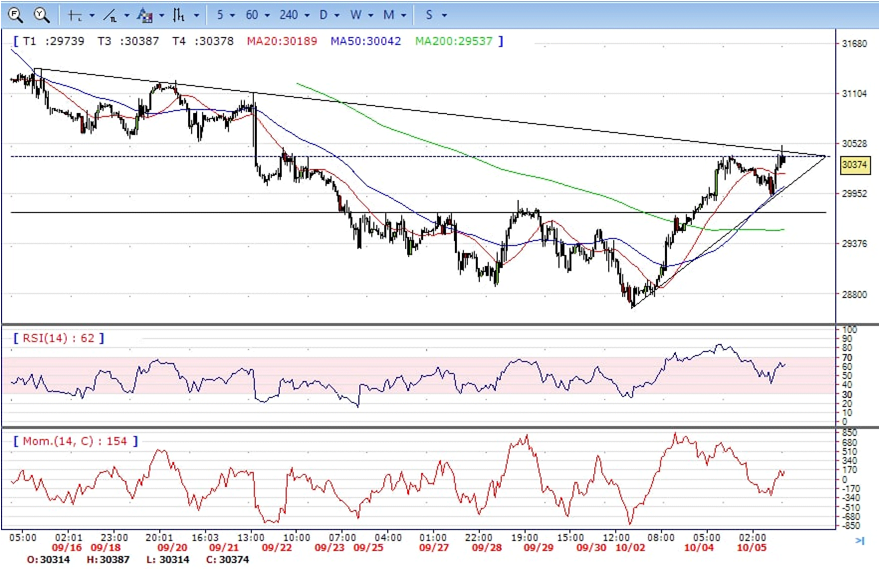
- DJI bounced from intraday low 29900, continued the advance to a fresh one week high around 30510. It retreated modestly and ended Tuesday around 30370, bullish in the hourly chart. It stabilized above all main SMAs, suggests bullish strength. Meanwhile, the 20 SMA started turning flat but continued developing above longer ones, suggesting bulls not exhausted yet. On upside, overcome 30510 may encourage bulls to challenge 30800, break above this level will open the gate to 31100.
- Technical indicators suggest the bullish strength. RSI stabilized around 61, while the Momentum indicator stabilized in positive territory, suggests upward potentials. On downside, the immediate support is 29900, break below this level will open the gate for more decline to 29700 area.
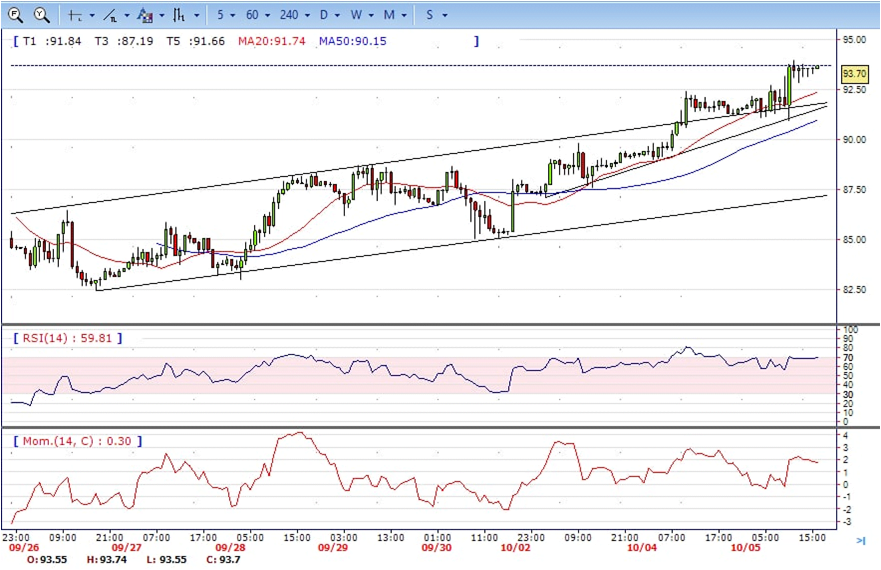
- Brent continued the advance, climbed from 90.93 low to 93.94 region. It retreated modestly and ended Tuesday around 91.50, still bullish in the hourly chart. The price stabilized above 20 and 50 SMAs, suggests bullish strength in short term. Meanwhile, the 20 SMA continued accelerating north and developing above longer ones, indicating bulls not exhausted yet. On upside, overcome 94.60 may encourage bulls to challenge 95.60, break above this level will open the gate to 97.00.
- Technical indicators suggest the bullish movement, hovering above the midline. RSI stabilized around 69, while the Momentum indicator stabilized in positive territory, suggests upward potentials. On downside, the immediate support is 92.40, break below this level will open the gate for more decline to 91.00 area.