05/06/2023 Daily Reports
- EUR/USD slumps from weekly highs reached as a knee-jerk reaction to a solid US jobs report, driving the pair towards 1.0779 before sliding toward daily lows. The labor market in the United States stayed strong but saw slight signs of weakness. At the time of writing, the EUR/USD is trading at 1.0707, printing losses of 0.44%.
- In early trading, before Wall Street opened, the US Department of Labor revealed May employment figures, with the economy adding 339K jobs, above estimates of 190K. Even though the figure is positive for the economy, the Unemployment Rate ticked to 3.7%, from 53-year lows of 3.4%, sought by the Fed as a sign that can undermine consumer spending. Average Hourly earnings rose 0.3%, up 4.3% YoY, less than April’s figure of 4.4%.
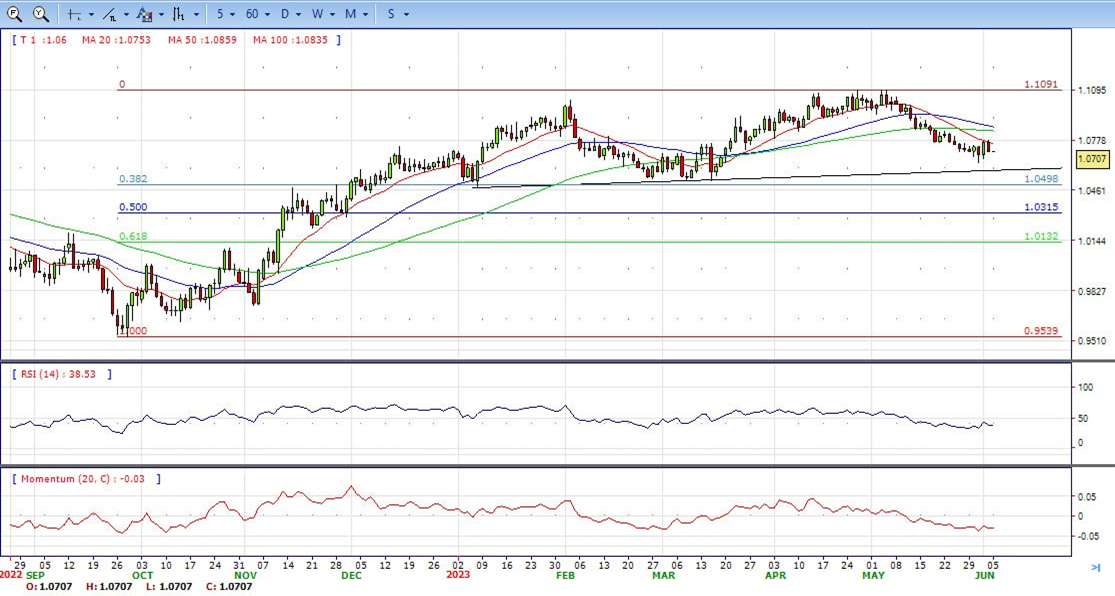
- The EUR/USD pair is trading near the 1.0707, down for the day with bearish stance in daily chart. The pair stabilized below 20 and 50 SMA, indicates bearish strength. Meanwhile, the 20 SMA started turning south and heading towards 50 and 200 SMA, suggests bears not exhausted yet. On upside, the immediate resistance is 1.0780, break above this level will extend the advance to 1.0850.
- Technical readings in the daily chart support the bearish stance. The RSI indicator stabilizes around 38. The Momentum indicator holds below the midline, indicating bearish potentials. On downside, the immediate support is 1.0630 and below this level will open the gate to 1.0500.
- The GBP/USD fell more than 0.50% to a daily low of 1.2453 at the end of the week, following robust labor market data from the US, indicating a possible reconsideration of further rate hikes by the Fed. As a result, the US Dollar strengthened due to rising US bond yields, while the Sterling Pound continued to face selling pressure while the British economic calendar had nothing relevant to offer.
- The US Dollar gains some positive traction in reaction to the upbeat headline NFP print and turns out to be a key factor exerting downward pressure on the GBP/USD pair. In fact, the US Bureau of Labor Statistics reported that the economy added 339K new jobs in May as compared to the 170K estimated and the previous month’s upwardly revised reading of 294K. Additional details, however, revealed that the Unemployment Rate, meanwhile, rose to 3.7% as compared to an expected uptick to 3.5% from 3.4% in April.
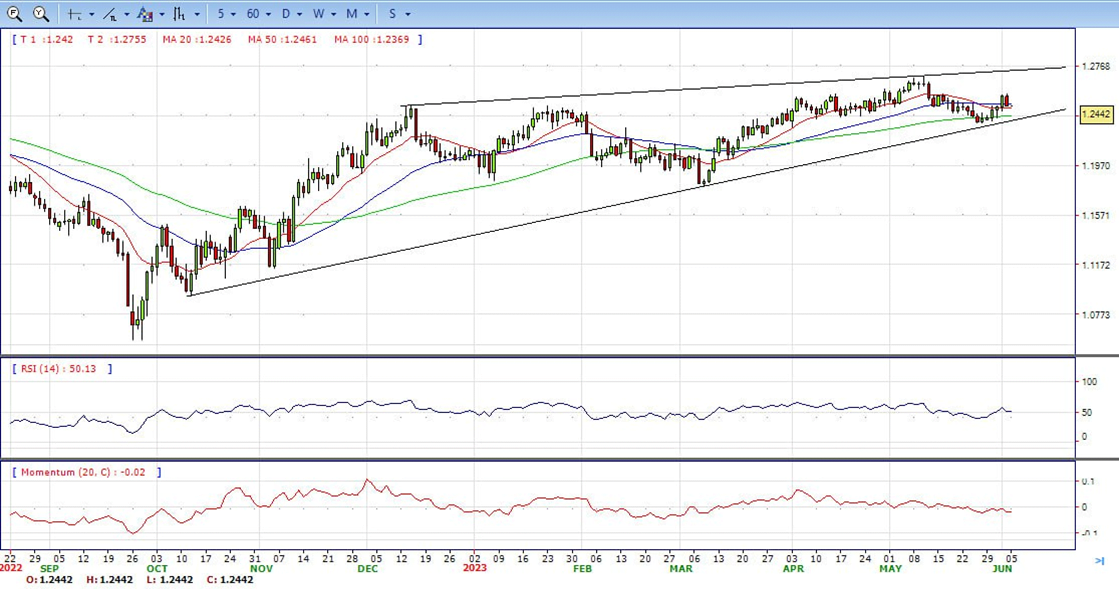
- The GBP/USD offers bullish stance in daily chart. Cable stabilizes above 20 and 50 SMA, indicating bullish strength in short term. Meanwhile, the 20 SMA started turning north and heading towards longer ones, suggests bulls not exhausted yet. On upside, the immediate resistance is 1.2550 with a break above it exposing to 1.2680.
- Technical readings in the daily chart support the neutral to bearish stances. RSI indicator stabilizes around 50, while the Momentum indicator stabilizes below the midline, suggesting downward potentials. On downside, the immediate support is 1.2400, unable to defend this level will resume the decline to 1.2300.


- Gold price slumps after hitting a daily high of $1978, as the release of a solid US jobs data report underpinned US Treasury bond yields, a headwind for the yellow metal. That, alongside a strong US Dollar, keeps XAU/USD downward pressured but still set to end the week with decent gains. At the time of writing, the XAU/USD is trading below the $1947 area.
- A risk on impulse keeps safe-haven assets under pressure, as Wall Street shrugged off a solid employment report from the United States. On Friday, the US Department of Labor revealed May’s Nonfarm Payrolls report, which crushed estimates of 190K, as the economy created 339K jobs. Regarding to the Unemployment Rate grew by 3.7% YoY from 3.4%.
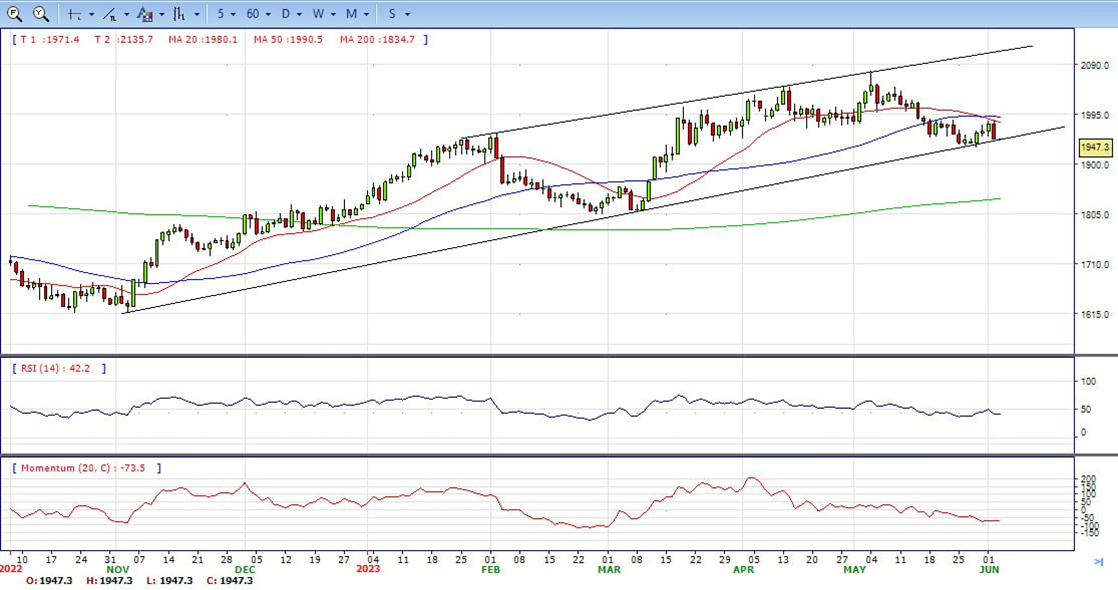
- Gold price stabilized around 1947, down for the day and bearish in the daily chart. The gold price stabilizes below 20 SMA, suggesting bearish strength in short term. However, the 20 SMA started turning flat but continued developing far above 50 and 200 SMA, indicates bulls not exhausted yet. On upside, the immediate resistance is 1985, break above this level will open the gate for more advance to 2000 area.
- From a technical perspective, the RSI indicator holds near the mid-line and stabilizes around 42, on a neutral strength. The Momentum indicator hold in negative territory, suggests downward potentials. On downside, the immediate support is 1931, below this area may resume the decline to 1900.


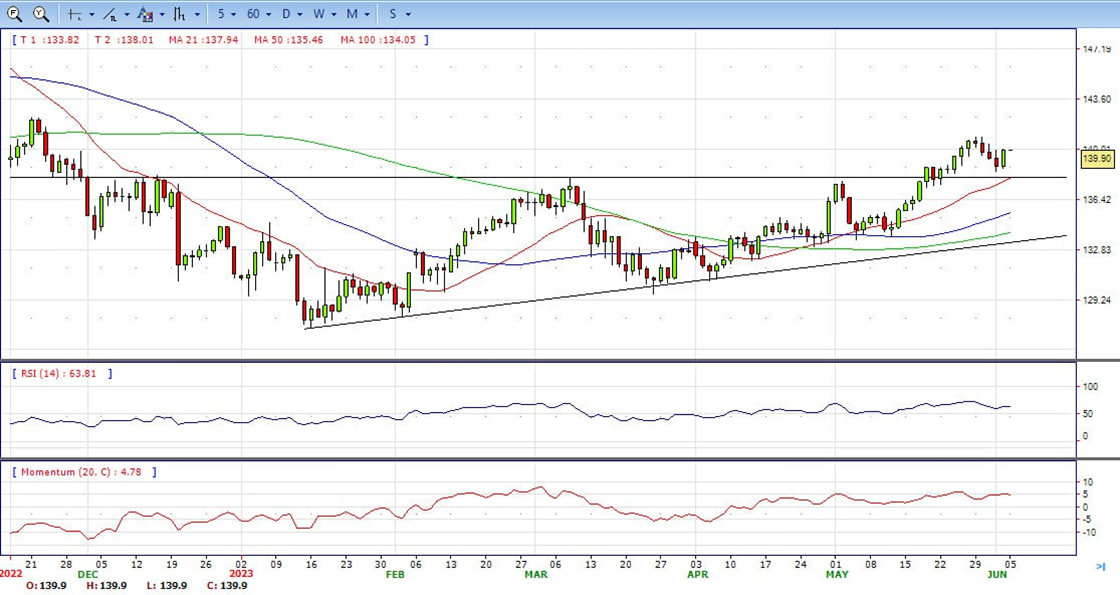
- The USD/JPY gained more than 80 pips on Friday, spiking to the 139.90 zone following the labor market data from the US which suggested that the Fed may reconsider a further hike. As a reaction, the US Dollar gained traction on the back of rising US bond yields while Japanese yields continue to decline.
- The US Bureau of Labor Statistics released that employment in the US measured by the NFP increased by 339k, way above the consensus of 190k. The Bureau stated that job gains were seen across various sectors, with notable increases in professional and business services and government employment. Other figures show that the Unemployment rate picked up to 3.7% in the same period of time vs the 3.5% expected while wage inflation measured by the Average Hourly Earnings, came in at 4.3% YoY vs the 4.4% expected.
- The USD/JPY pair stabilized around 139.90, up for the day and bullish in the daily chart. The price stabilizes above 20 and 50 SMA, suggests bullish strength in short term. Meanwhile, 20 SMA continued accelerating north and developing above longer ones, indicating bulls not exhausted. On upside, overcome 140.00 may encourage bulls to challenge 141.00, break above that level will open the gate to 142.30.
- Technical indicators suggest the bullish strength. RSI stabilizes around 63, while the Momentum indicator stabilizes above the midline, suggests upward potentials. On downside, the immediate support is 138.40, break below this level will open the gate to 137.20 area.
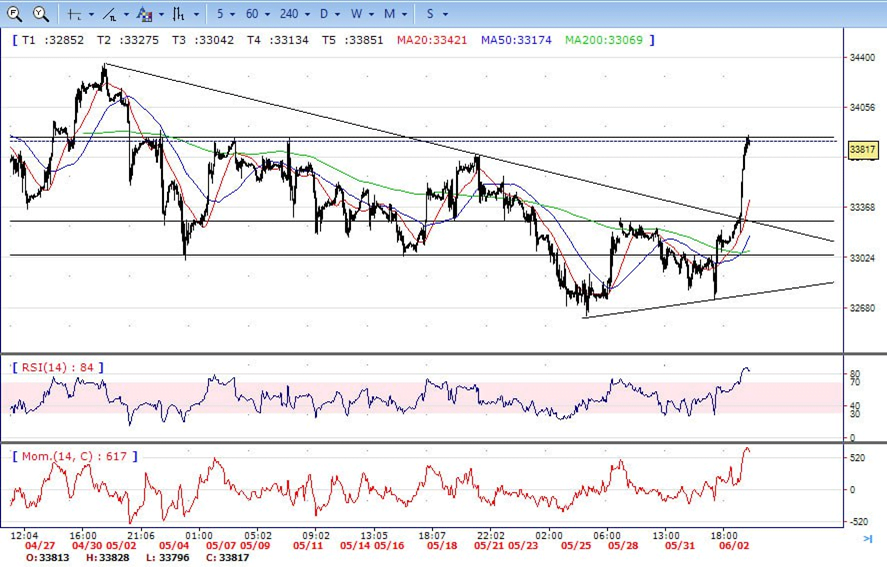
- DJI made a strong rally, jumped from intraday low 33150 area to intraday high 33870. It retreated modestly and ended the day around 33800, above 20 and 50 SMA, suggests bullish strength. Meanwhile, 20 SMA continued accelerating north and developing above longer ones, suggests bulls not exhausted yet. On upside, overcome 33880 may encourage bulls to challenge 34050, break above that level will open the gate to 34360.
- Technical indicators suggest the bullish movement. RSI stabilizes around 84, while the Momentum indicator stabilizes above the midline, suggests upward potentials. On downside, the immediately support is 33500, break below this level will open the gate for more decline to 33300 area.
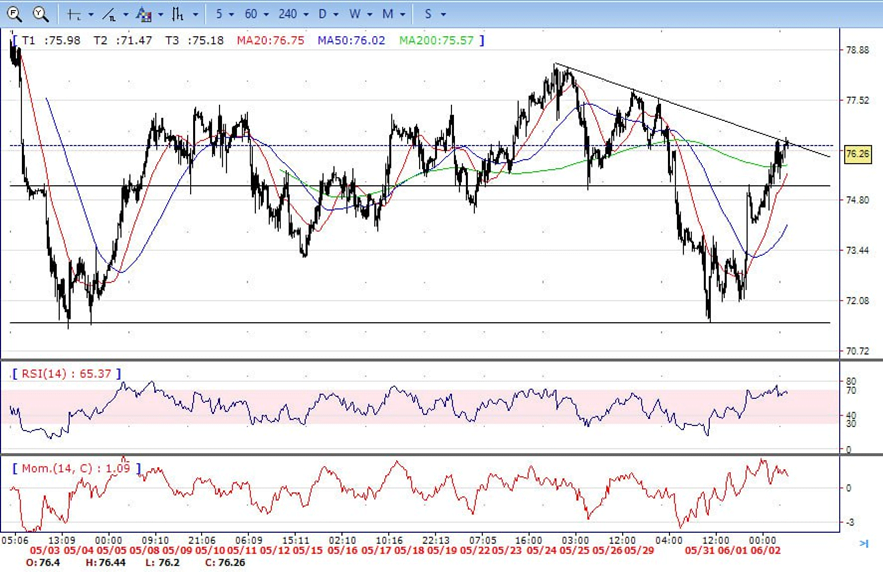
- Brent made a strong rally on Friday, traded from intraday low 74.15 area to high 76.50 level. It retreated modestly and ended the day around 76.25, up for the day and stabilized above 20 and 50 SMA, indicates bullish sign in the hourly chart. Meanwhile, the 20 SMA started turning north and heading towards longer ones, indicates bulls not exhausted yet. On upside, overcome 76.50 may encourage bulls to challenge 77.40, break above that level will open the gate to 78.50.
- Technical indicators also suggest bullish movement, hovering above the midline. RSI stabilizes at 66, while the Momentum indicator stabilizes in positive territory, suggests upward potentials. On downside, the immediately support is 75.20, break below this level will open the gate for more decline to 74.10 area.