03/02/2023 Daily Reports
- The buying bias in the European currency run out of further steam and forced EUR/USD to return to the negative ground after climbing as high as the 1.1030 zone earlier in the session, accelerates its daily losses and hovers just above 1.0900 region at the end of US session.
- Indeed, the central bank raised the interest rate on the main refinancing operations, the interest rate on the marginal lending facility and the deposit facility to 3.0%, 3.25% and 2.50%, respectively. The ECB reiterated that further rate hikes remain on the cards – with another 50 bps “scheduled” at the March gathering – and the decision on future rate raises will remain data-dependent and in a meeting-by-meeting approach.
- Lagarde noted that the economic activity in the region slowed markedly and growth is expected to remain weak, while elevated inflation and tighter financial conditions remain a headwind for spending and production. She also highlighted the resilience of the economy and suggested that a recovery is expected in the next months, while inflation risks have become more balanced..
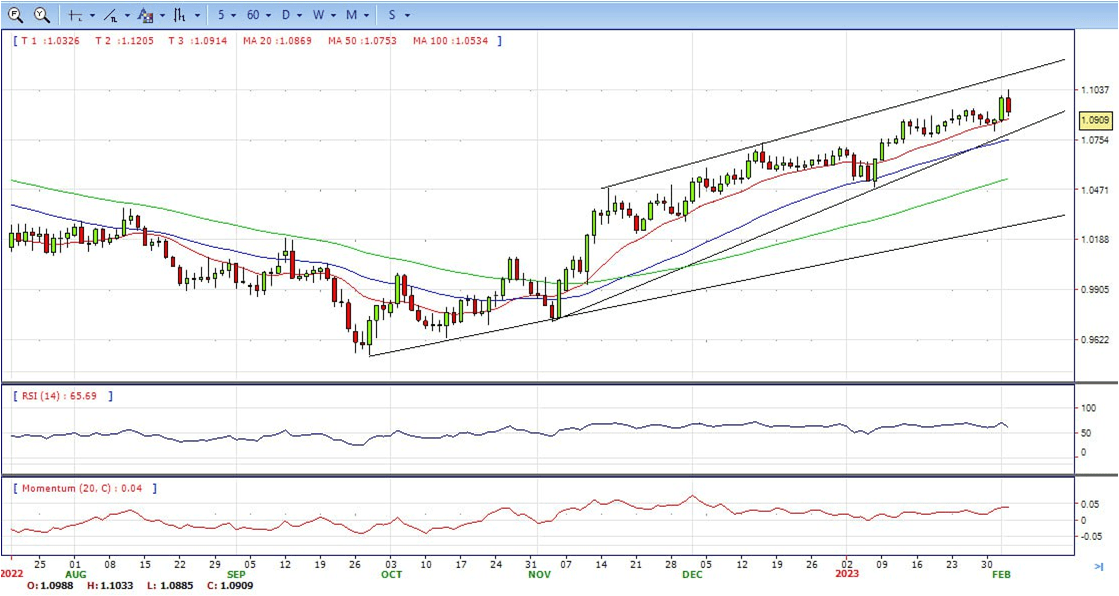
- The EUR/USD pair is trading near the 1.0905, down for the day with bullish stance in daily chart. The pair still stabilized above 20 and 50 SMA, indicates bullish strength. Meanwhile, the 20 SMA continued accelerating north and developing far above longer ones, suggests bulls not exhausted yet. On upside, the immediate resistance is 1.1000, break above this level will extend the advance to 1.1100.
- Technical readings in the daily chart support the bullish stance. The RSI indicator is above 62. The Momentum indicator stabilizes in positive territory, indicating bullish potentials. On downside, the immediate support is 1.0870 and below this level will open the gate to 1.0800.
- The GBP/USD collapses after the BoE decision to raise the Bank Rate by 50 bps to the 4% threshold. Economic data revealed in the US reassured the tightness of the labour market, meaning that the US Federal Reserve, albeit hiked rates 25 bps on Wednesday, still has ways to go. At the time of typing, the GBP/USD exchanges hands at 1.2230 after hitting a high of 1.2401.
- Before Wall Street opened, BoE lifted rates to its highest peak since 2008, from 3.50% to 4%, in a split 7-2 vote, as two members voted for no change to the Bank Rate. Following the BoE’s decision, its Governor Bailey said that “we’ve seen the first signs that inflation has turned the corner,” but commented that it’s too soon to declare victory, adding that members of the Monetary Policy Committee would need to be “absolutely sure” that inflation is cooling.
- Aside from this, the US Department of Labour revealed that Initial Jobless Claims for the last week ending on January 28 dropped to 183K, slightly below the last week’s 186K and lower than the 200K estimated by street analysts, showing the labour market resilience. Today’s data added to Wednesday’s JOLTs report that showed vacancies rising, while an ISM report on Wednesday stated that manufacturers “are not substantially” reducing their personnel.
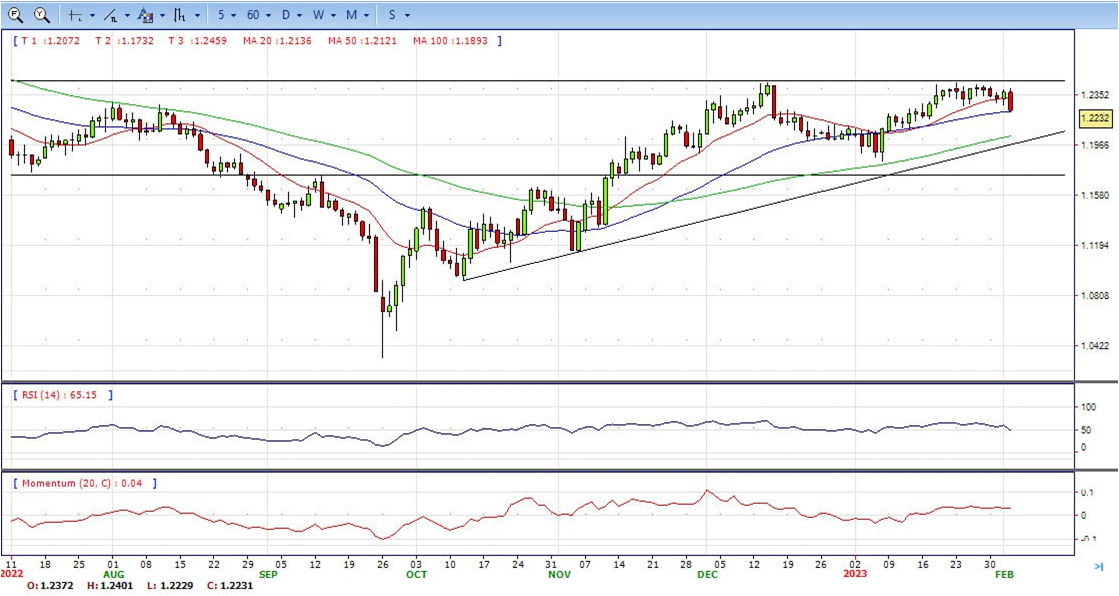
- The GBP/USD offers neutral to bullish stance in daily chart. Cable stabilizes between 20 and 50 SMA, indicating neutral to bullish strength in short term. Meanwhile, the 20 and 50 SMA continues accelerating north and developing above 200 SMA, suggests bulls not exhausted yet. On upside, The immediate resistance is 1.2450 with a break above it exposing to 1.2580.
- Technical readings in the daily chart support the neutral to bullish stances. RSI indicator stabilizes around 50, while the Momentum indicator stabilizes above the midline, suggesting upward potentials. On downside, the immediate support is 1.2220, unable to defend this level will resume the decline to 1.2080.


- Gold price retreats after hitting a nine-month high at $1,959.7, it is below the $1,950 barrier at the time of writing after ECB and BoE rate decision.
- Walk Street is set to extend its Wednesday gains after Jerome Powell, and Co. lifted rates by 25 bps in line with expectations. Powell said in the Fed conference that the “disinflation process has started,” suggesting future tightening might be limited and giving the green light to risk-perceived assets, which extended their rally as Powell spoke. Gold experienced collateral damage from the pivot into riskier assets.
- In the meantime, the US Dollar Index is trimming some of its losses, up 0.44%, at 101.61, bolstered by weakness in two of its main counterparts, the Euro and the Pound Sterling. Global bond yields are plummeting, with the US 10-year benchmark note rate down six bps, at 3.354%. Normally a positive for the non-yielding Gold, this has not been the case on this occasion and the precious metal has failed to gain traction.
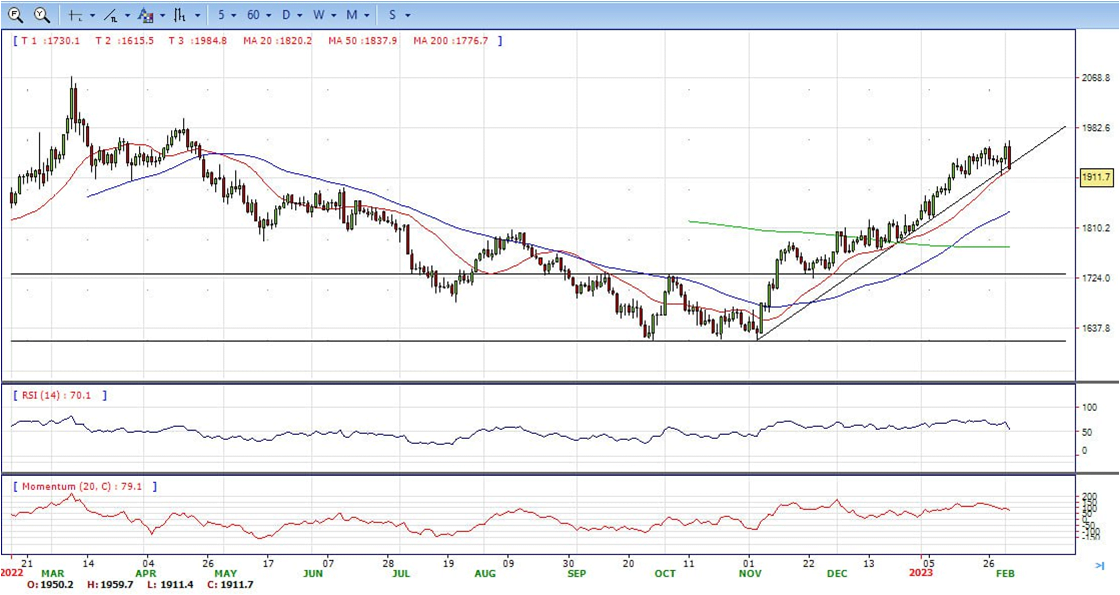
- Gold price stabilized around 1913, down for the day and bullish in the daily chart. The gold price still stabilized above 20 and 50 SMA, suggesting bullish strength in short term. Meanwhile, the 20 and 50 SMA continued accelerating north and developing above 200 SMA, indicating bulls not exhausted yet. On upside, the immediate resistance is 1955, break above this level will open the gate for more advance to 1982 area.
- From a technical perspective, the RSI indicator holds above the mid-line and stabilizes around 55, still on a bullish strength. The Momentum indicator continues developing in positive territory, suggests more upside potentials. On downside, the immediate support is 1900, below this area may resume the decline to 1867.


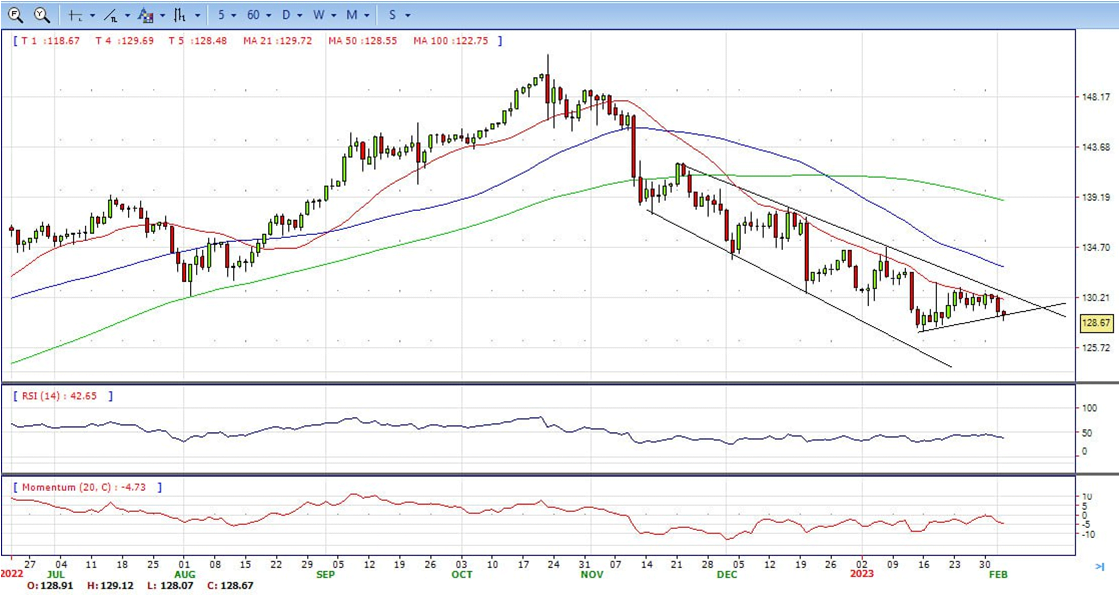
- The USD/JPY dropped further on Thursday and bottomed at 128.07, reaching the lowest level in two weeks. It remained above 128.50 and trimmed losses after US markets opened.
- Following the announcements of Fed, ECB and BoE, sovereign bonds rose, favouring the Japanese Yen across the board. The US 10-year yield fell to as low as 3.33%, the lowest in two weeks, before rebounding to 3.37%. The German 10-year yield stands at 2.10%, down 6.70% for the day. The 10-year UK bond yields drops 5.95% at 3.09%.
- US data was offset by central banks on Thursday but on Friday the Non-farm payroll report is due and will be watched closely. Data released on Thursday showed Initial Jobless Claims surprised fell to 183K, the lowest level since April. Factory Orders rose 1.8% in December, below the expected 2.2%.
- The USD/JPY pair stabilized around 128.60, down for the day and bearish in the daily chart. The price maintains the downward slope and develops below all main SMAs, suggests bearish strength in short term. Meanwhile, 20 SMA continued accelerating south and developing below longer ones, indicating bears not exhausted. On upside, overcome 131.10 may encourage bulls to challenge 131.60, break above that level will open the gate to 133.00.
- Technical indicators still suggest the bearish strength. RSI fell to 39, while the Momentum indicator stabilize in negative territory, suggests downward potentials. On downside, the immediate support is 128.00, break below this level will open the gate to 127.20 area.
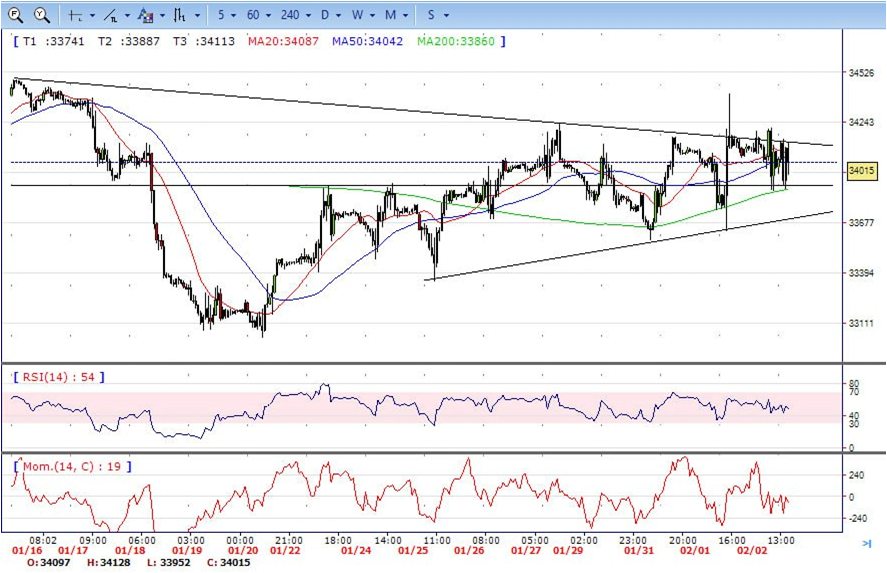
- DJI was very volatile on most of the day post Fed decision, tumbled from intraday high 34210 area to intraday low 33870 area twice and ended Thursday around 34015, down for the day and indicates bearish sign in the hourly chart. Right now market is standing below 20 and 50 SMAs, suggests bearish strength. Meanwhile, 20 SMA started turning south and heading towards 50 SMA, suggests bears not exhausted yet. On upside, overcome 34200 may encourage bulls to challenge 34400, break above that level will open the gate to 34680.
- Technical indicators also suggest the bearish movement, developing below the mid-line. RSI stabilized around 47, while the Momentum indicator hovering well below the midline, suggests downward potentials. On downside, the immediately support is 33870, break below this level will open the gate for more decline to 33580 area.
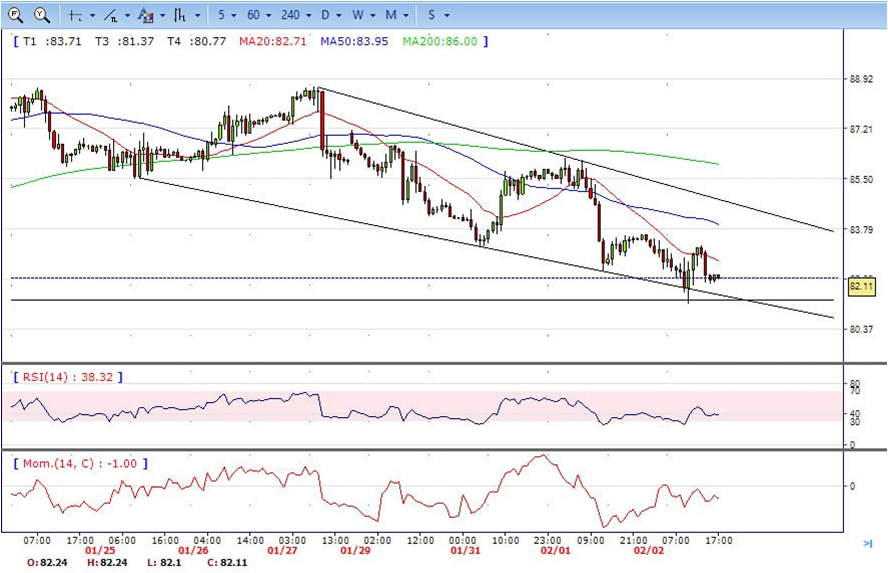
- The Brent still under the sell pressure on Thursday, dropped from intraday high 83.60 area to low 81.26. It recovered some losses and ended Thursday around 82.10. The price still stabilized below 20 and 50 SMA, suggests bearish strength in the hourly chart. Meanwhile, the 20 SMA continued accelerating south and developing below longer ones, indicates bears not exhausted yet. On upside, overcome 83.60 may encourage bulls to challenge 84.80, break above that level will open the gate to 86.20.
- Technical indicators also suggest bearish movement, hovering below the midline. RSI drops to 38, while the Momentum indicator stabilizes in negative territory, suggests downward potentials. On downside, the immediately support is 81.20, break below this level will open the gate for more decline to 80.50 area.