02/06/2023 Daily Reports
- EUR/USD shifted gears after printing a weekly low of 1.0635, climbs bolstered by dovish US Fed officials’ comments, alongside soft economic data from the US. Therefore, investors looking towards a less hawkish Fed dumped the US Dollar in favour of riskier assets. At the time of writing, the EUR/USD exchanges hands at 1.0758, more than 0.50% above its opening price.
- US equities are trading in positive territory amidst weakening manufacturing activity in the US, which could warrant a Fed’s pause on its tightening cycle. The ISM Manufacturing PMI in May, slipped to 46.9, falling under both April’s 47.1 and the expected 47. These sub-50 readings generally indicate a recessionary phase, weighed by a plunge in new orders.
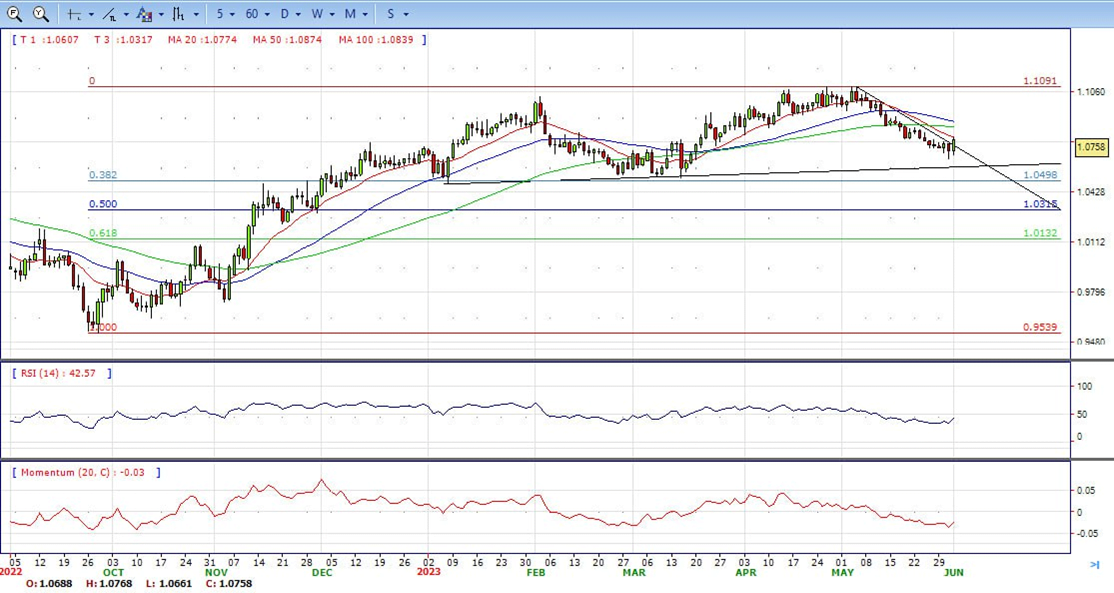
- The EUR/USD pair is trading near the 1.0758, up for the day with bearish stance in daily chart. The pair stabilized below 20 and 50 SMA, indicates bearish strength. Meanwhile, the 20 SMA started turning south and heading towards 50 and 200 SMA, suggests bears not exhausted yet. On upside, the immediate resistance is 1.0770, break above this level will extend the advance to 1.0850.
- Technical readings in the daily chart support the bearish stance. The RSI indicator stabilizes around 42. The Momentum indicator holds below the midline, indicating bearish potentials. On downside, the immediate support is 1.0630 and below this level will open the gate to 1.0500.
- GBP/USD edges higher in the North American session, boosted by downbeat economic data from the US, with business activity slowing. Additionally, US Fed officials pushing for a “skip” on its tightening cycle eased the odds for a rate hike at the upcoming June meeting. The GBP/USD is trading at around 1.2520s after hitting a low of 1.2400.
- Wall Street shifted positively as data from the ISM revealed that manufacturing activity slid for the seven straight months. The ISM Manufacturing PMI came at 46.9, below April’s 47.1 and below estimates of 47, with readings below 50 seen as recessionary. Factors like 500 bps of aggressive tightening by the Fed weighed on the index as new orders plunged.
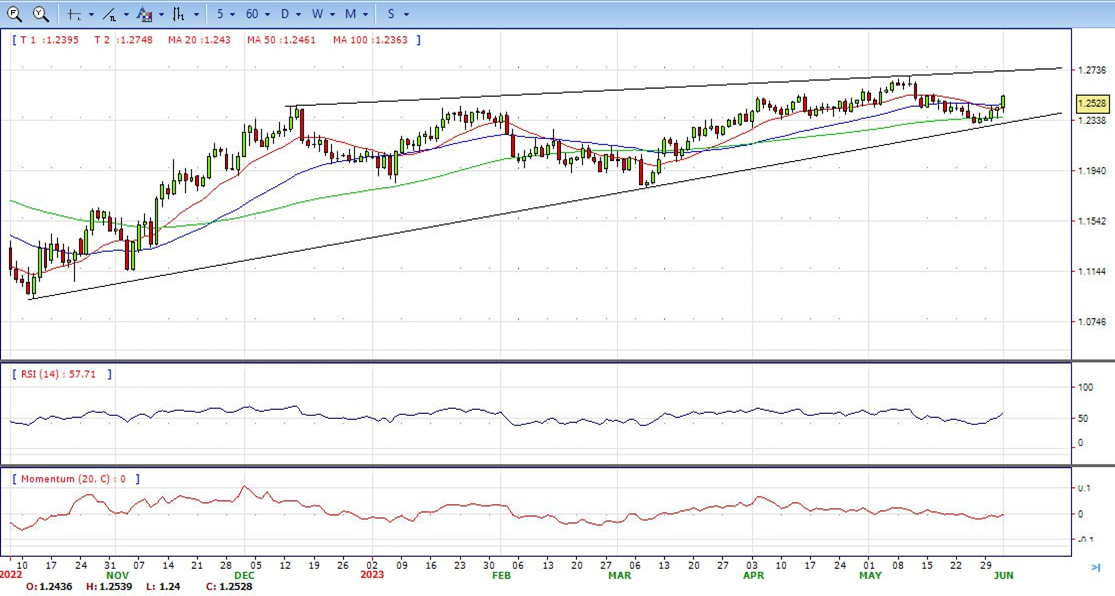
- The GBP/USD offers bullish stance in daily chart. Cable stabilizes above 20 and 50 SMA, indicating bullish strength in short term. Meanwhile, the 20 SMA started turning north and heading towards longer ones, suggests bulls not exhausted yet. On upside, the immediate resistance is 1.2550 with a break above it exposing to 1.2680.
- Technical readings in the daily chart support the bullish stances. RSI indicator stabilizes around 57, while the Momentum indicator stabilizes near the midline, suggesting directionless potentials. On downside, the immediate support is 1.2400, unable to defend this level will resume the decline to 1.2300.


- Gold prices advanced for the third consecutive day as US Treasury yields continue to decline. XAU/USD pair recently jumped to $1,983, hitting a one-week high following the release of the US ISM Manufacturing PMI.
- The dollar’s decline accelerated after the May ISM Manufacturing PMI showed a decline in the main index from 47.1 to 46.9, below the market consensus of 47. The Price Paid Index also fell considerably from 53.2 to 44.2, against expectations of 52, while the Employment Index unexpectedly rose from 50.2 to 51.4.
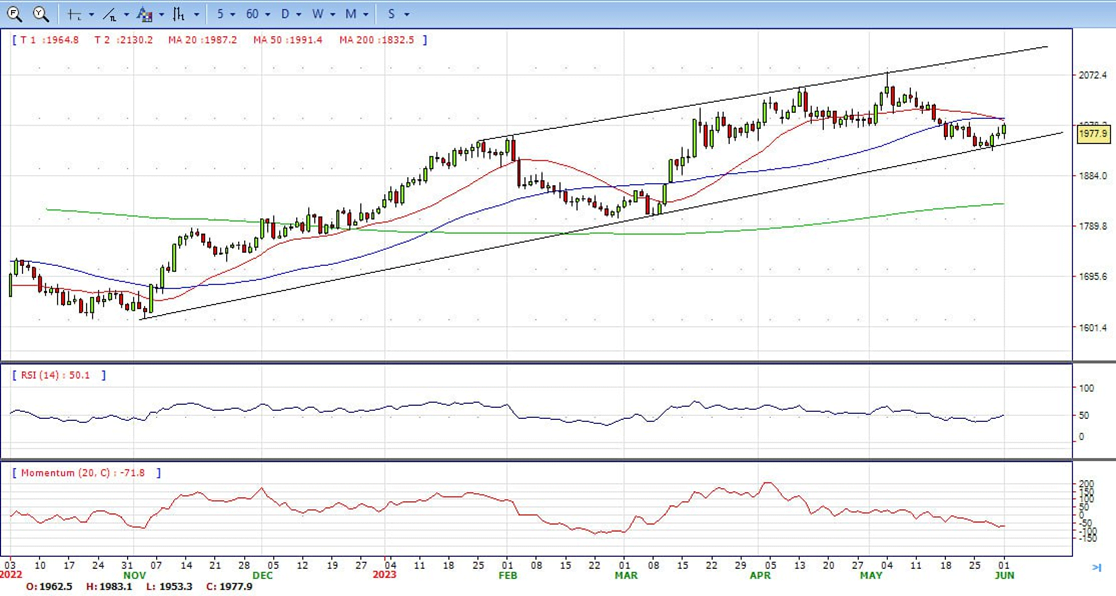
- Gold price stabilized around 1978, up for the day and bearish in the daily chart. The gold price stabilizes below 20 SMA, suggesting bearish strength in short term. However, the 20 SMA started turning flat but continued developing far above 50 and 200 SMA, indicates bulls not exhausted yet. On upside, the immediate resistance is 1985, break above this level will open the gate for more advance to 2000 area.
- From a technical perspective, the RSI indicator holds near the mid-line and stabilizes around 50, on a neutral strength. The Momentum indicator hold in negative territory, suggests downward potentials. On downside, the immediate support is 1950, below this area may resume the decline to 1932.


- The USD/JPY pair struggles to capitalize on its intraday positive move and meets with a fresh supply in the vicinity of the 140.00 psychological mark on Thursday. Spot prices retreat to the lower end of the daily range and trade above the 138.42 mark, or a one-week low touched earlier today, despite the better-than-expected US ADP report.
- Data published by ADP showed that US private sector employers added 278K jobs in May, lower than the 296K in the previous month, though well above consensus estimates for a reading of 170K. The initial market reaction fades rather quickly amid reduced bets for another 25 bps rate hike by the Fed in June. This, in turn, keeps the USD bulls on the defensive and acts as a headwind for the USD/JPY pair.
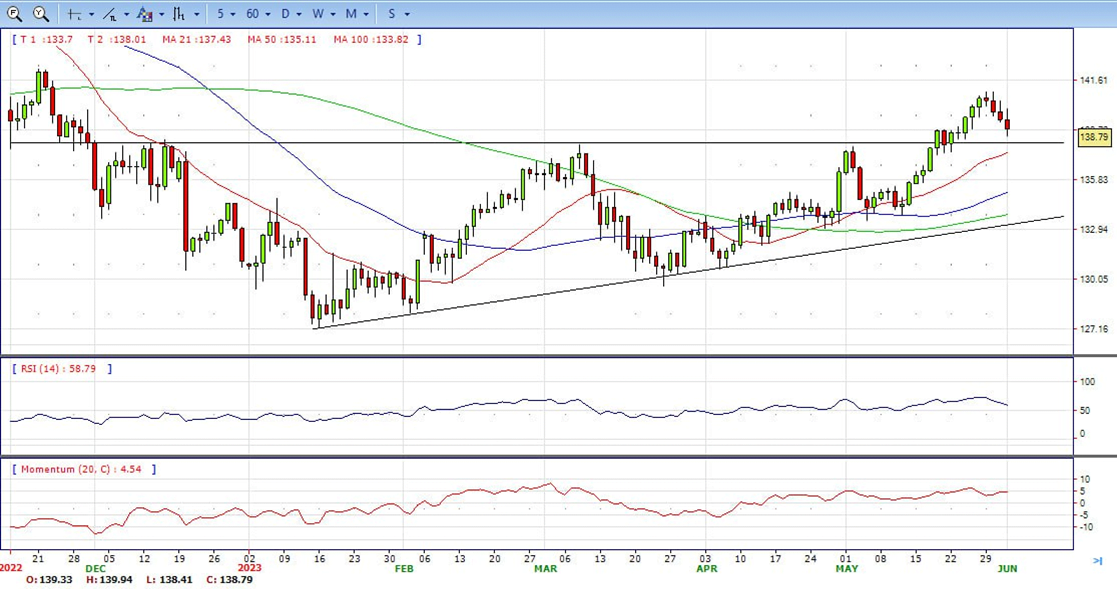
- The USD/JPY pair stabilized around 138.80, down for the day and bullish in the daily chart. The price stabilizes above 20 and 50 SMA, suggests bullish strength in short term. Meanwhile, 20 SMA continued accelerating north and developing above longer ones, indicating bulls not exhausted. On upside, overcome 140.00 may encourage bulls to challenge 141.00, break above that level will open the gate to 142.30.
- Technical indicators suggest the bullish strength. RSI stabilizes around 58, while the Momentum indicator stabilizes above the midline, suggests upward potentials. On downside, the immediate support is 138.40, break below this level will open the gate to 137.20 area.
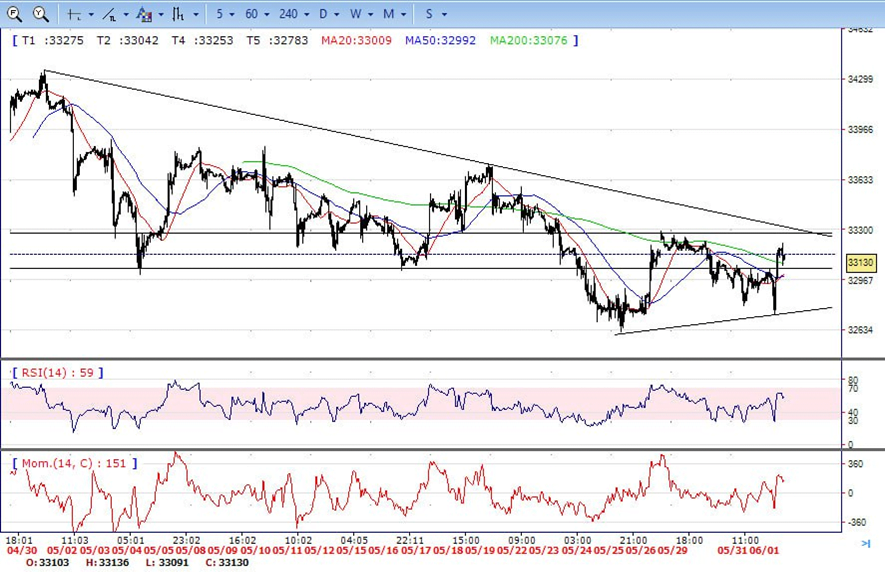
- DJI tumbled to fresh low 32737 in the London session, it then bounced from here and made a U turn, jumped to intraday high 33180. It retreated modestly and ended the day around 33130, above 20 and 50 SMA, suggests bullish strength. Meanwhile, 20 SMA started turning north and heading towards longer ones, suggests bulls not exhausted yet. On upside, overcome 33300 may encourage bulls to challenge 33550, break above that level will open the gate to 33730.
- Technical indicators suggest the bullish movement. RSI stabilizes around 58, while the Momentum indicator stabilizes above the midline, suggests upward potentials. On downside, the immediately support is 33000, break below this level will open the gate for more decline to 32740 area.
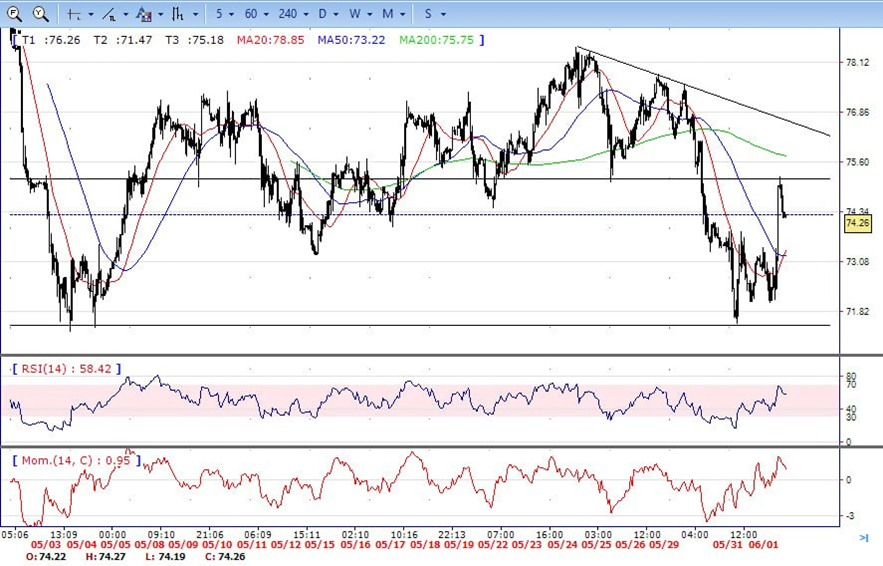
- Brent made a strong rally on Thursday, traded from intraday low 72.00 area to high 75.24 level. It retreated modestly and ended the day around 74.30, up for the day and stabilized above 20 and 50 SMA, indicates bullish sign in the hourly chart. Meanwhile, the 20 SMA started turning north and heading towards longer ones, indicates bulls not exhausted yet. On upside, overcome 75.20 may encourage bulls to challenge 76.20, break above that level will open the gate to 77.40.
- Technical indicators also suggest bullish movement, hovering above the midline. RSI stabilizes at 59, while the Momentum indicator stabilizes in positive territory, suggests upward potentials. On downside, the immediately support is 73.20, break below this level will open the gate for more decline to 71.30 area.