EUR/USD
- At the time of writing, EUR/USD is down some 0.29% falling to a low of 1.0354 from a higher of 1.0496. Risk currencies, such as the Euro are under pressure as protests against COVID restrictions in China weighed on market sentiment.
- The violent protests in major Chinese cities over the weekend against the country’s strict zero-COVID curbs have knocked growth expectations in the world’s second-largest economy. This is creating a flight to safety in support of the yen, US Dollar and CHF.
- Meanwhile, the economic challenges facing the euro area are not the same as in the US which is a weight on the euro. ”Supply-side shocks set the scene for an extended period of high inflation coupled with lacklustre growth. A recession seems difficult to avoid and we expect Gross Domestic Product to decline by 0.9% in 2023, followed by stagnation in 2024,
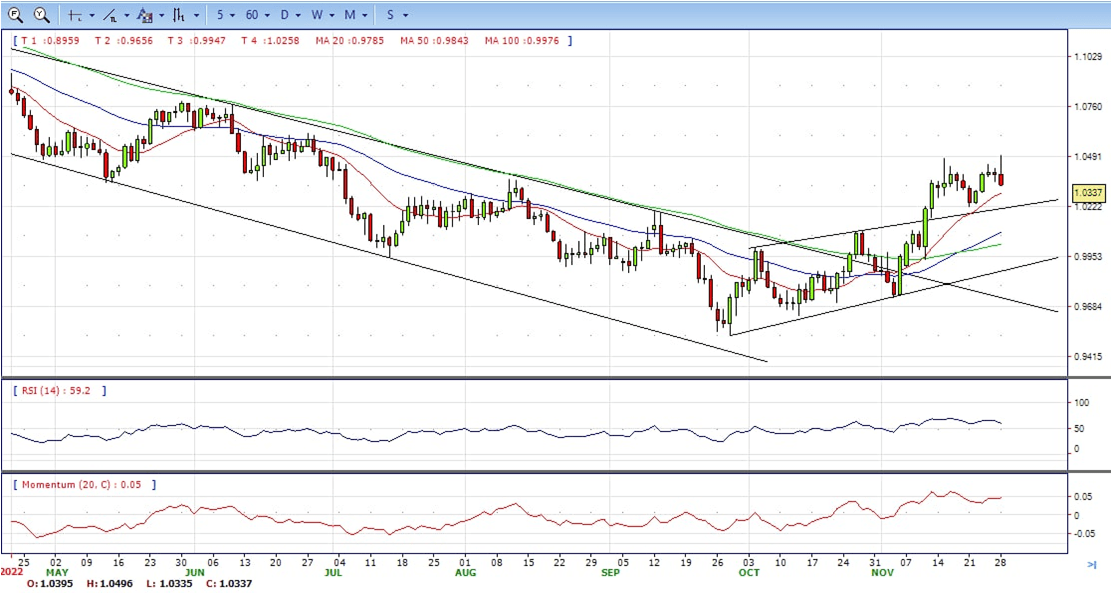
- The EUR/USD pair is trading near the 1.0330, down for the day with bullish stance in daily chart. The pair stabilized above 20 and 50 SMA, indicates bullish strength. Meanwhile, the 20 SMA continued accelerating north and developing above longer ones, suggests bulls not exhausted yet. On upside, the immediate resistance is 1.0500, break above this level will extend the advance to 1.0600.
- Technical readings in the daily chart support the bullish stances. The RSI indicators hovering above the midline and stabilized around 60. The Momentum indicator stabilized above the midline, indicating upward potentials. On downside, the immediate support is 1.0300 and below this level will open the gate to 1.0200.
Open A Demo
CDO has wide range of tools, professional and friendly support for clients to achieve their financial markets trading goals. Open a live account now to enjoy this experience with virtual deposit.
GBP/USD
- At the time of writing, GBP/USD is down some 1% falling to a low of 1.1945 from a high of 1.2111. Risk currencies, such as the British pound, are under pressure as protests against COVID restrictions in China knocked market sentiment.
- GBP/USD is falling below the psychological 1.2000 level and meeting short-term dynamic support. Additionally, fears of a lengthy UK recession were seen weighing on sentiment. Investors await to see what the Bank of England’s (BoE) next move will be. There will be several BoE members due to speak this week, including BoE governor Andrew Bailey on Tuesday and chief economist Huw Pill on Wednesday.
- Meanwhile, Federal Reserve speakers will be key this week. On Monday, New York Federal Reserve Bank President John Williams said that he believes the Fed will need to raise rates to a level sufficiently restrictive to push down on inflation, and keep them there for all of next year.
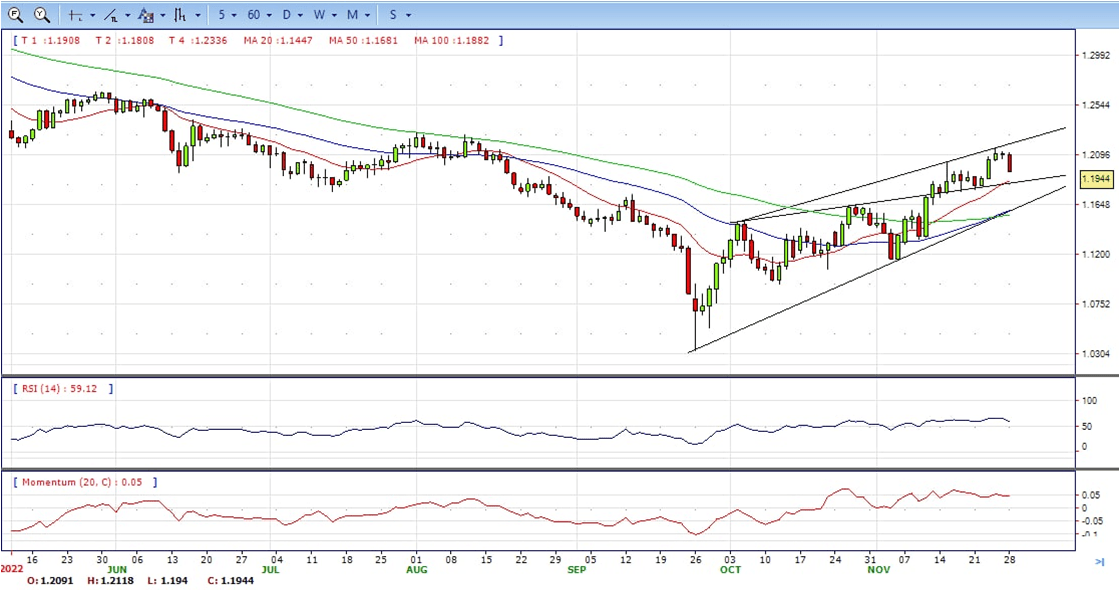
- The GBP/USD offers bullish stance in daily chart. Cable still stabilized above all main SMAs, indicating bullish strength in short term. Meanwhile, the 20 SMA continued accelerating north and developing above longer ones, suggests bulls not exhausted yet. On upside, The immediate resistance is 1.2020 with a break above it exposing to 1.2150.
- Technical readings in the daily chart support the bullish stances. RSI indicator stabilized around 60, while the Momentum indicator stabilized above the midline, suggesting upward potentials. On downside, the immediate support is 1.1900, unable to defend this level will resume the decline to 1.1760.

CDO TRADER
CDO TRADER, our cutting-edge trading platform, follows the technology from the forefront with new features added continuously. Moreover, CDO TRADER is now available for Android and iOS! So it allows you to trade on the go!
XAU/USD
- Gold price edges lower as trading in the US begins after hitting a daily high of $1763.75. China’s protests about its Covid-19 zero-tolerance policy and its economic consequences weigh on sentiment even though Fed officials laid the ground for moderated rate hikes. At the time of writing, the XAU/USD is trading at $1741, below its opening price by 0.50%.
- Global equities are trading in the red, spurred by China’s civil unrest, as protesters take the streets sparked by the Covid-19 zero-tolerance policy and mass testing, keeping investors on their toes. However, Gold’s safe-haven status kept the yellow metal from falling further while also benefitting from a soft US Dollar.
- In the meantime, the US docket will be busy. On the labor market side, the release of November’s ADP Employment Change report, October’s JOLTs Job Openings, Initial Jobless Claims for the last week, and the Nonfarm Payrolls for November would update the employment situation. Regarding the PMIs, the ISM Manufacturing PMIs would be released alongside the Chicago PMI and the S&P Global PMI.
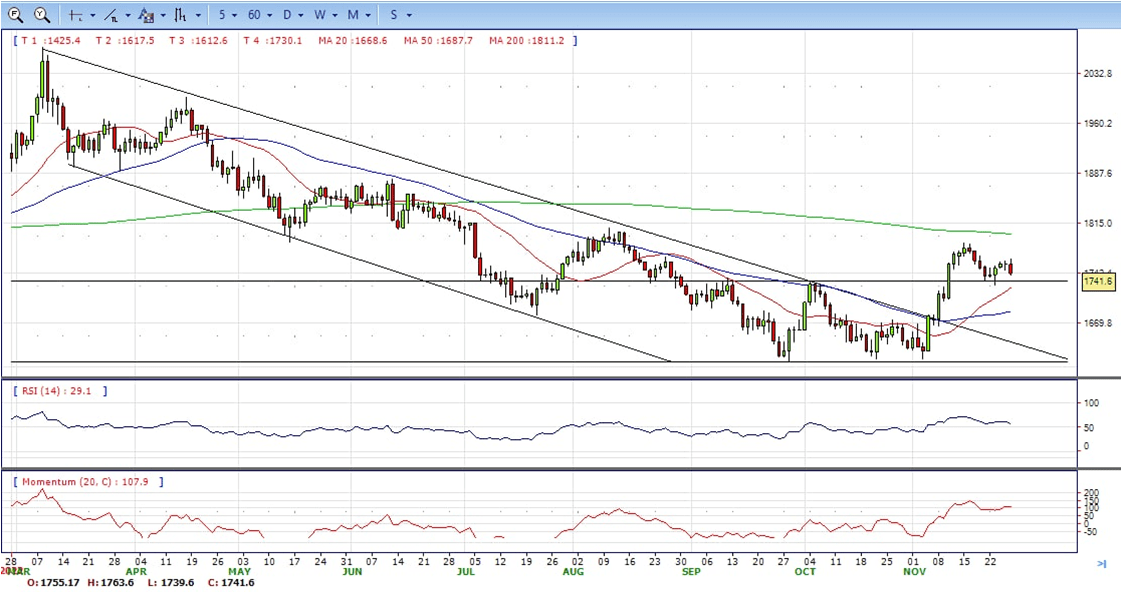
- Gold price stabilized around 1741, down for the day and bullish in the daily chart. The gold price still stabilized above 20 and 50 SMA, suggesting bullish strength. Meanwhile, the 20 SMA continued accelerating north and developing above longer ones, indicating bulls not exhausted yet. On upside, the immediate resistance is 1787, break above this level will open the gate to extend the advance to 1800 area.
- From a technical perspective, the RSI indicator hold above the midline and stabilized around 57, suggesting bullish strength. The Momentum indicator stabilized above the midline, suggests upward potentials. On downside, the immediate support is 1730, below this area may resume the decline to 1700.
MetaTrader 4
MT4 has user friendly interface that is providing simplicity and efficiency. The traders can perform trading strategies for different products like Forex and CFD. MetaTrader 4 has over 50 built-in indicators, also it’s the tool that predicts trends and defines the appropriate entry and exit points.

USD/JPY
- The USD/JPY is falling in the North American session, comfortable below the 139.00 figure after hitting a daily low of 137.49, reaching a fresh three-month low on a soft US Dollar (USD). At the time of writing, the USD/JPY is trading at 138.80, below its opening price by 0.25%.
- The US Dollar fails to capitalize on its modest intraday uptick and comes under heavy selling pressure amid the prospects for a less aggressive policy tightening by the Fed. In fact, the USD Index, which measures the greenback’s performance against a basket of currencies, dives back closer to the monthly low and turns out to be a key factor exerting pressure on the USD/JPY pair.
- The November FOMC meeting minutes released last week cemented bets for a relatively smaller 50 bps rate hike by the US central bank in December. This is reinforced by the ongoing downfall in the US Treasury bond yields, narrowing the US-Japan rate differential. Apart from this, the risk-off mood benefits the safe-haven Japanese Yen and contributes to the USD/JPY pair’s intraday decline.
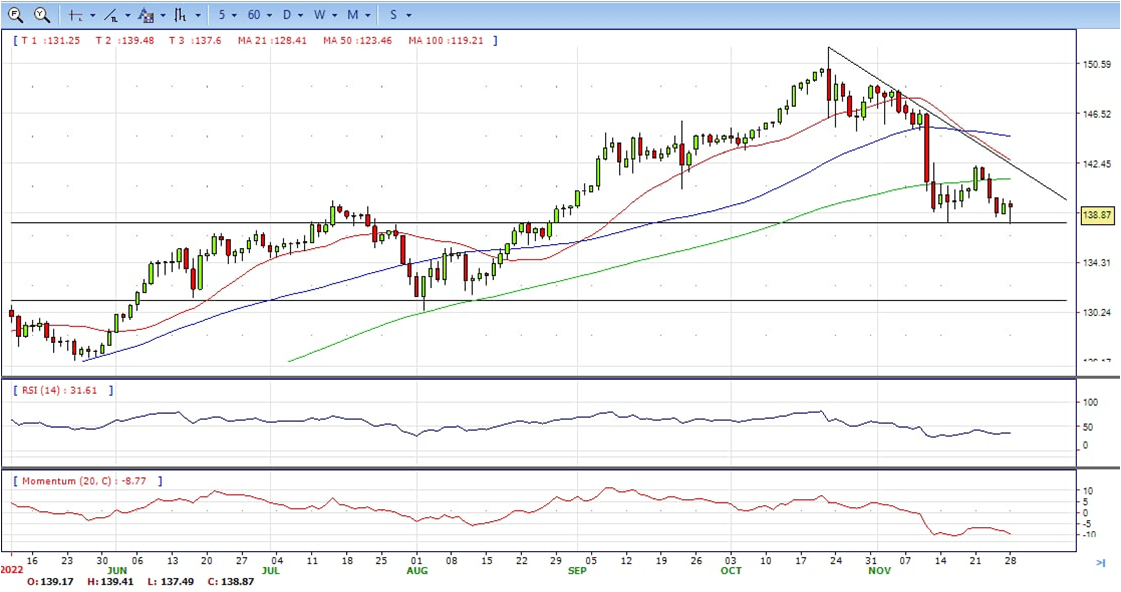
- The USD/JPY pair stabilized around 138.80, down for the day and bearish in the daily chart. The price still maintains the downward slope and develops below all main SMAs, suggests bearish strength in short term. Meanwhile, 20 SMA continued accelerating south and heading towards longer ones, indicating bears not exhausted. On upside, overcome 139.70 may encourage bulls to challenge 141.00, break above that level will open the gate to 141.60.
- Technical indicators suggest the bearish strength. RSI stabilized around 36, while the Momentum indicator continued developing below the midline, suggests downward potentials. On downside, the immediate support is 137.50, break below this level will open the gate to 136.00 area.
DJI
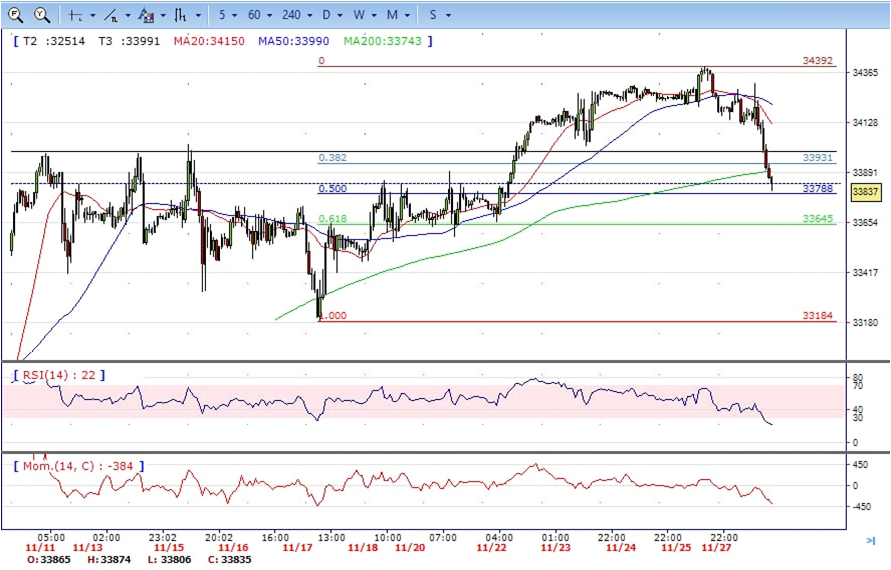
- DJI under the strong sell pressure on Monday due to the Covid cases surged in China. The price tumbled from intraday high 34393 to low 33806 and ends Monday nearby, down for the day and bearish in the hourly chart. The price stabilized below all main SMAs, suggests bearish strength. Meanwhile, 20 SMA continued accelerating south and developing below 50 SMA, suggests bears not exhausted yet. On upside, overcome 34000 may encourage bulls to challenge 34200, break above this level will open the gate to 34400.
- Technical indicators suggest the bearish strength. RSI stabilized around 24, while the Momentum indicator stabilized below the midline, suggests downward potentials. On downside, the immediate support is 33800, break below this level will open the gate for more decline to 33600 area.
BRENT
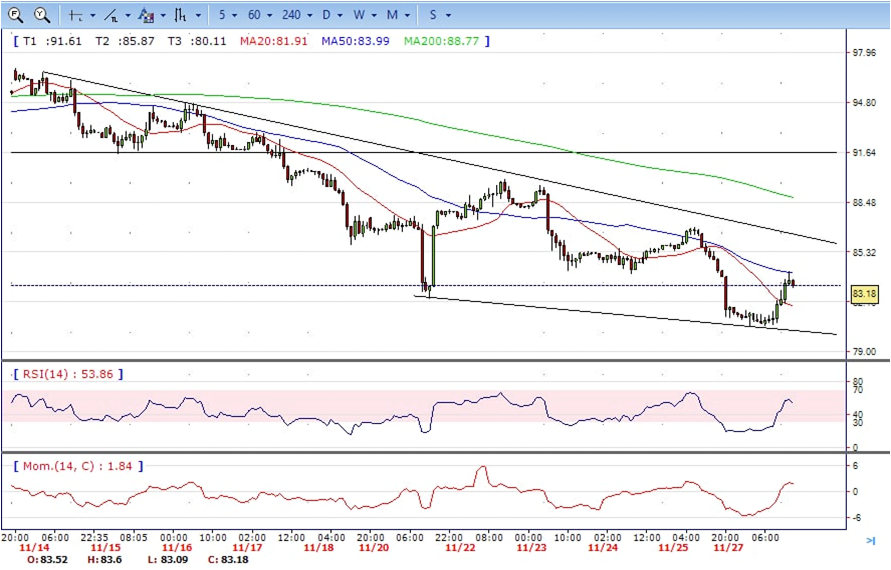
- Brent continued under the sell pressure amid the demand concern from China. It slumped to intraday low 80.60 area then bounced quickly to around 84.00. It ended Monday at around 82.50, down for the day and neutral in the hourly chart. The price stabilized above 20 SMA but capped by 50 SMA, suggests neutral to bullish strength in short term. Meanwhile, the 20 SMA continued developing far below 50 and 200 SMA despite it started turning flat, indicating bearish bias. On upside, overcome 84.00 may encourage bulls to challenge 87.00, break above this level will open the gate to 90.00.
- Technical indicators suggest the neutral to bullish movement, hovering above the midline. RSI stabilized at around 54, while the Momentum indicator stabilized above the midline, suggests upward potentials. On downside, the immediate support is 80.60, break below this level will open the gate for more decline to 79.00 area.
Contact Us
Please, fill the form to get an assistance.


