23/11/2022 Daily Reports
- At 1.0295, EUR/USD is 0.53% higher in late trade in North American trade as the US Dollar retreated across the board on Tuesday while investors look past worries about China’s COVID flare-ups, boosting demand for more risky currencies.
- The greenback edged lower on Tuesday amid the better performance of global equities and weaker US Treasury yields. Activity, however, was limited ahead of the FOMC Meeting Minutes and US Durable Goods Orders to be out on Wednesday.
- Asian and European indexes closed in the green, while Wall Street posted substantial gains, adding the most in the final hours of trading. On the other hand, US Treasury yields edged lower with the 10-year note yield down 7 bps to hover around 3.75%, and the 2-year offering 4.51% barely down for the day.
- The EUR/USD pair is trading near the 1.0295, up for the day with bullish stance in daily chart. The pair stabilized above 20 and 50 SMA, indicates bullish strength. Meanwhile, the 20 SMA continued accelerating north and developing above longer ones, suggests bulls not exhausted yet. On upside, the immediate resistance is 1.0310, break above this level will extend the advance to 1.0400.
- Technical readings in the daily chart support the bullish stances. The RSI indicators hovering above the midline and stabilized around 61. The Momentum indicator stabilized above the midline, indicating upward potentials. On downside, the immediate support is 1.0200 and below this level will open the gate to 1.0100.

- The Pound Sterling climbed in the North American session, albeit Fed hawkish commentary continued, though officials expressed the likelihood of moderating the pace. Another factor, China’s Covid-19 outbreak, sparked investors’ fears, though they waned as Wall Street is trading in the green. At the time of writing, the GBP/USD is trading at 1.1890, above its opening price by 0.45%.
- On Monday, San Francisco Fed President Mary Daly said she’s worried about overtightening, and she foresees rates initially at 5%, and from there, rates could go higher, depending on data. The Cleveland Fed President Loretta Mester said that slowing the pace of interest rates in the next month is possible. Mester commented that pausing is not an option and agreed with Daly, expecting rates at around 5%.
- On the United Kingdom (UK) side, the British Pound is underpinned by expectations that the Bank of England (BoE) would raise borrowing costs as they scramble to control 40-years high inflation. Regarding the Autumn Budget presented by Chancellor Jeremy Hunt was well received by investors, with some analysts saying that it is a deflationary budget.
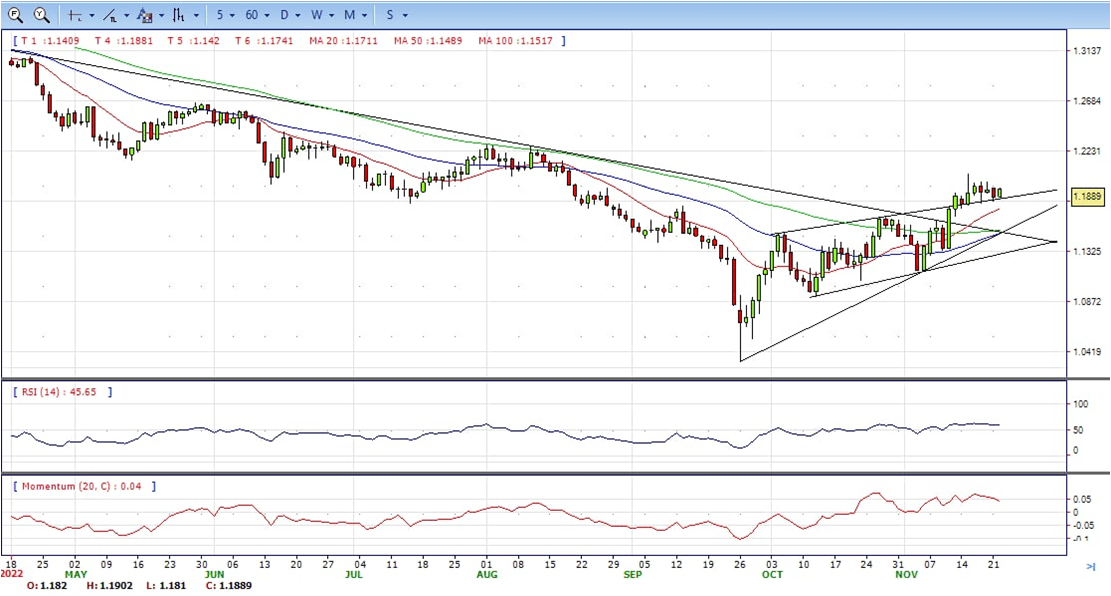
- The GBP/USD offers bullish stance in daily chart. Cable still stabilized above all main SMAs, indicating bullish strength in short term. Meanwhile, the 20 SMA continued accelerating north and developing above longer ones, suggests bulls not exhausted yet. On upside, The immediate resistance is 1.2030 with a break above it exposing to 1.2150.
- Technical readings in the daily chart support the bullish stances. RSI indicator stabilized around 60, while the Momentum indicator stabilized above the midline, suggesting upward potentials. On downside, the immediate support is 1.1750, unable to defend this level will resume the decline to 1.1640.


- Gold Price is almost flat on Tuesday’s North American session, capitalizing on a soft US Dollar still off the daily highs as Fed officials continued to express the US central bank needs to tighten monetary conditions. Also, sentiment remains fragile due to Covid-19 cases in China. At the time of writing, the XAU/USD is trading at $1739.70, unchanged.
- Sentiment improved throughout the day. Federal Reserve policymakers grabbed investors’ attention as the US central bank prepared to slow down borrowing costs. Loretta Mester, Cleveland Fed President, said, “Maintaining price stability is a critical objective that will be accomplished using all available means.” On Monday, Mester commented that she Is open to moderate rate hikes, though she emphasized that a pause is off the table. She echoed some of San Francisco Fed President Mary Daly’s comments, which added that the Federal Funds rate needs to peak at around 5%.
- Elsewhere, the US Dollar Index, which tracks the greenback value against six currencies, slashes 0.50% down to 107.200. US Treasury yields are also dropping, led by the 10-year benchmark note rate yielding 3.750%, eight bps down compared to Monday’s close, a headwind for the greenback.
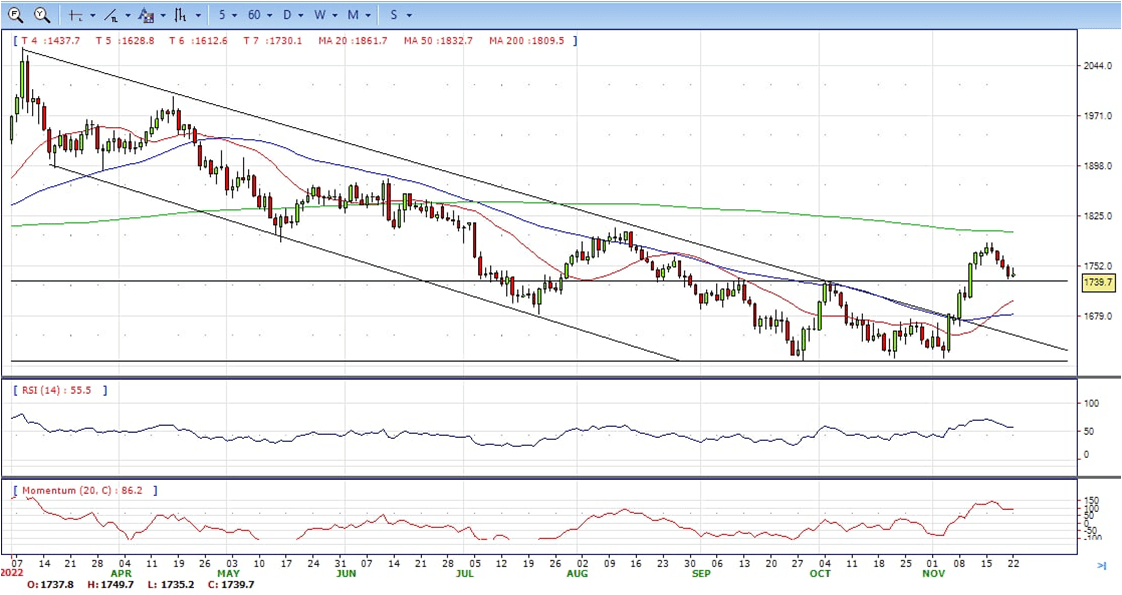
- Gold price stabilized around 1739, unchanged for the day and bullish in the daily chart. The gold price still stabilized above 20 and 50 SMA, suggesting bullish strength. Meanwhile, the 20 SMA started turning north and heading towards longer ones, indicating bulls not exhausted yet. On upside, the immediate resistance is 1787, break above this level will open the gate to extend the advance to 1800 area.
- From a technical perspective, the RSI indicator hold above the midline and stabilized around 58, suggesting bullish strength. The Momentum indicator stabilized above the midline, suggests upward potentials. On downside, the immediate support is 1730, below this area may resume the decline to 1700.


- The USD/JPY pair struggles to capitalize on the previous day’s breakout momentum beyond the 140.80 and meets with a fresh supply on Tuesday. The pair remains depressed through the early North American session, albeit manages to rebound a few pips from the vicinity of the 141.00 mark, or the daily low.
- The US Dollar comes under some renewed selling pressure and stalls its recent strong recovery from a three-month low, which, in turn, is exerting downward pressure on the USD/JPY pair. Investors now seem convinced that the Federal Reserve will slow the pace of its rate-hiking cycle and have been pricing in a greater chance of a relatively smaller 50 bps lift-off in December. This leads to a fresh leg down in the US Treasury bond yields and keeps the USD bulls on the defensive.
- This marks a big divergence in the monetary policy stance adopted by the two major central banks, which might continue to undermine the Japanese Yen. Apart from this, a slight recovery in the global risk sentiment, which tends to dent demand for traditional safe-haven currencies, including the JPY, might contribute to limiting losses for the USD/JPY pair. Investors might also prefer to wait for a fresh catalyst from the FOMC meeting minutes, due for release on Thursday.
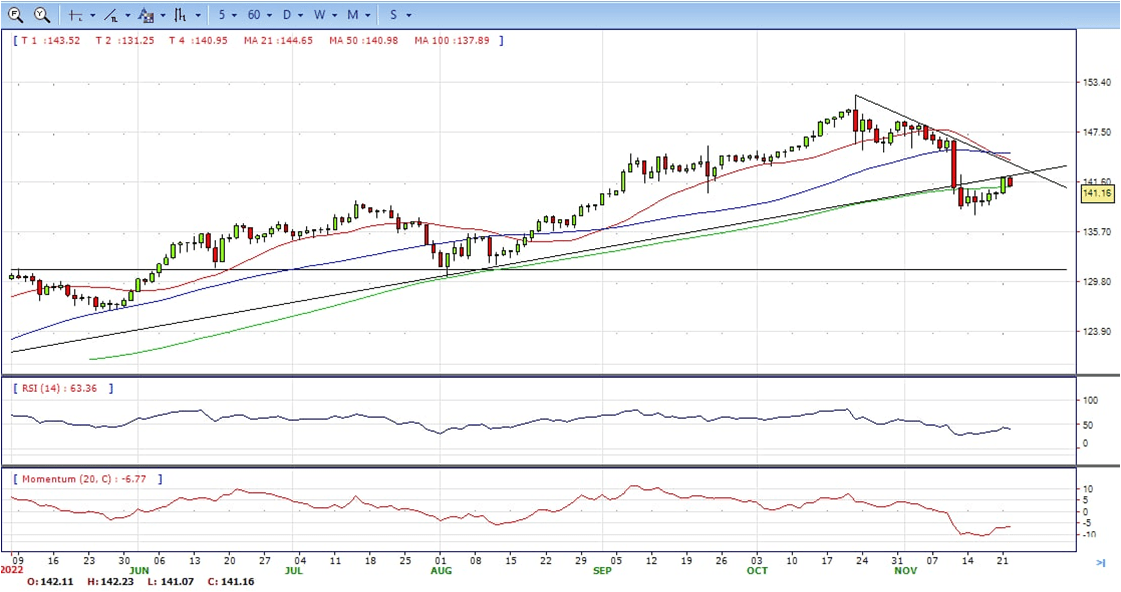
- The USD/JPY pair stabilized around 141.10, down for the day and bearish in the daily chart. The price still maintains the downward slope and develops below all main SMAs, suggests bearish strength in short term. Meanwhile, 20 SMA continued accelerating south and heading towards longer ones, indicating bears not exhausted. On upside, overcome 142.50 may encourage bulls to challenge 144.00, break above that level will open the gate to 145.30.
- Technical indicators suggest the bearish strength. RSI stabilized around 39, while the Momentum indicator continued developing below the midline, suggests downward potentials. On downside, the immediate support is 140.80, break below this level will open the gate to 139.00 area.
- DJI made a breakout on upside, jumped above 34030 strong resistance zone and ended Tuesday at around 34130, up for the day and bullish in the hourly chart. The price stabilized above all main SMAs, suggests bullish strength. Meanwhile, 20 continued accelerating north and developing above longer ones, suggests bulls not exhausted yet. On upside, overcome 34330 may encourage bulls to challenge 34600, break above this level will open the gate to 34800.
- Technical indicators suggest the bullish strength. RSI stabilized around 77, while the Momentum indicator stabilized above the midline, suggests upward potentials. On downside, the immediate support is 34000, break below this level will open the gate for more decline to 33800 area.

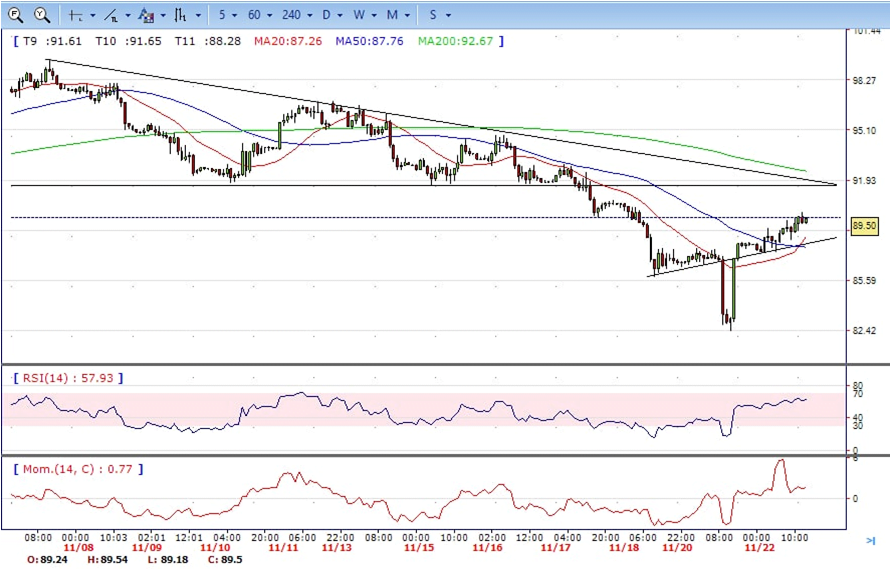
- Brent continued the advance, climbed from intraday low 87.30 to intraday high 89.90 area, it trimmed some gains on the last hour of US session and ended Tuesday at around 88.50, up for the day and bullish in the hourly chart. The price stabilized above 20 and 50 SMA, suggests bullish strength in short term. Meanwhile, the 20 SMA continued accelerating north and developing above 50 SMA, indicating bullish bias. On upside, overcome 90.00 may encourage bulls to challenge 90.70, break above this level will open the gate to 91.60.
- Technical indicators suggest the bullish movement, hovering above the midline. RSI stabilized at around 63, while the Momentum indicator stabilized above the midline, suggests upward potentials. On downside, the immediate support is 87.20, break below this level will open the gate for more decline to 85.70 area.