EUR/USD
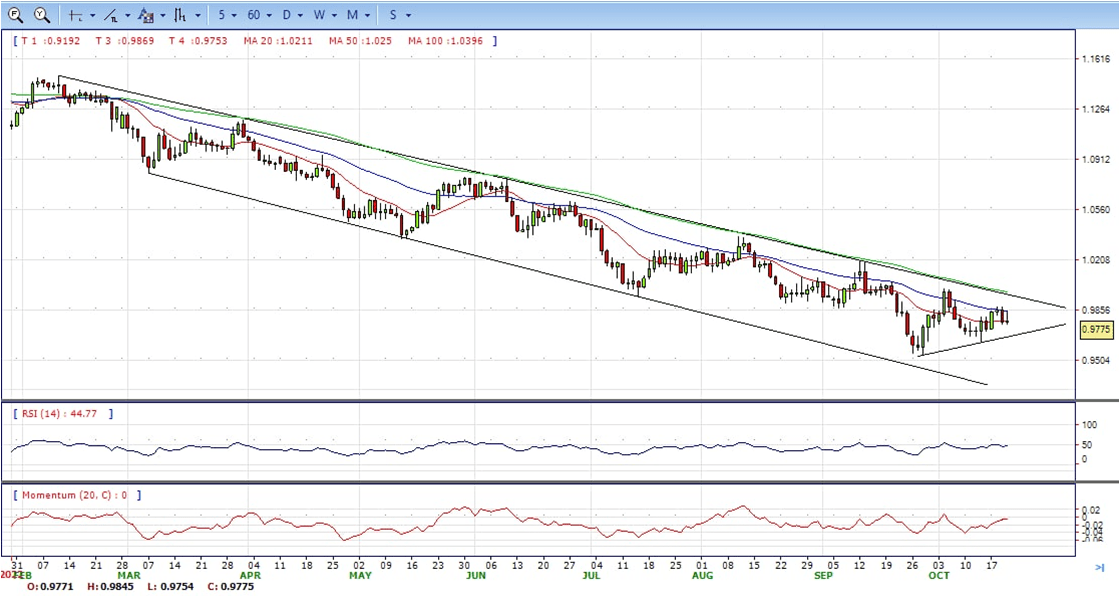
- EUR/USD renews its intraday high around 0.9845 amid the fresh decline in the US dollar. In doing so, the quote pares the previous day’s losses, the biggest in two weeks, amid an absence of major data/events. The pair trimmed the gains and back to familiar range 0.9770 are to end Thursday, neutral to bearish in the daily chart.
- China’s debate on reducing quarantine time for international travelers seemed to have triggered the US dollar’s latest weakness amid a likely sluggish session. With this, the US Dollar Index (DXY) reverses the Asian session gains and prints 0.12% loss on the day as it refreshes intraday low to 112.77 at the latest.
- Moving on, a light calendar and a sudden shift in the risk profit could probe the EUR/USD from declining further. However, the recovery remains doubtful unless the yields start deteriorating and the DXY also ease, which is less expected.
- The EUR/USD pair is trading near the 0.9770, unchanged for the day with the neutral stance in daily chart. The pair stabilized between 20 and 50 SMA, indicates neutral strength. Meanwhile, the 20 SMA continued developing below longer ones despite it started turning flat, suggests bears not exhausted yet. On upside, the immediate resistance is 0.9875, break above this level will extend the advance to 1.0000.
- Technical readings in the daily chart support the neutral stances. The RSI indicators hovering near the midlines and stabilized around 50. The Momentum indicator stabilized in the negative territory, indicating downward potentials. On downside, the immediate support is 0.9740 and below this level will open the gate to 0.9630.
Open A Demo
CDO has wide range of tools, professional and friendly support for clients to achieve their financial markets trading goals. Open a live account now to enjoy this experience with virtual deposit.
GBP/USD
- The pound has given away most of the ground taken after the announcement of Prime Minister Truss’s resignation and remains practically unchanged on the daily chart.
- The U-turn on the tax cuts plan and finally the Prime Minister’s demise has prompted investors to scale down hopes of an aggressive BoE rate hike in November. MPC member Broadbent affirmed earlier on Thursday that the bank will respond to Britain’s tax and spending policies, in a hint that interest rates might not rise as much as expected.
- Truss came to power with an economics program that roiled financial markets in September, triggering a sharp sell-off on the British pound that forced the Bank of England to step in with a bond-buying program. The tax-cuts fiasco divided the Tory party and caused the resignation of two of her ministers in less than six weeks, hurting the country’s credibility.
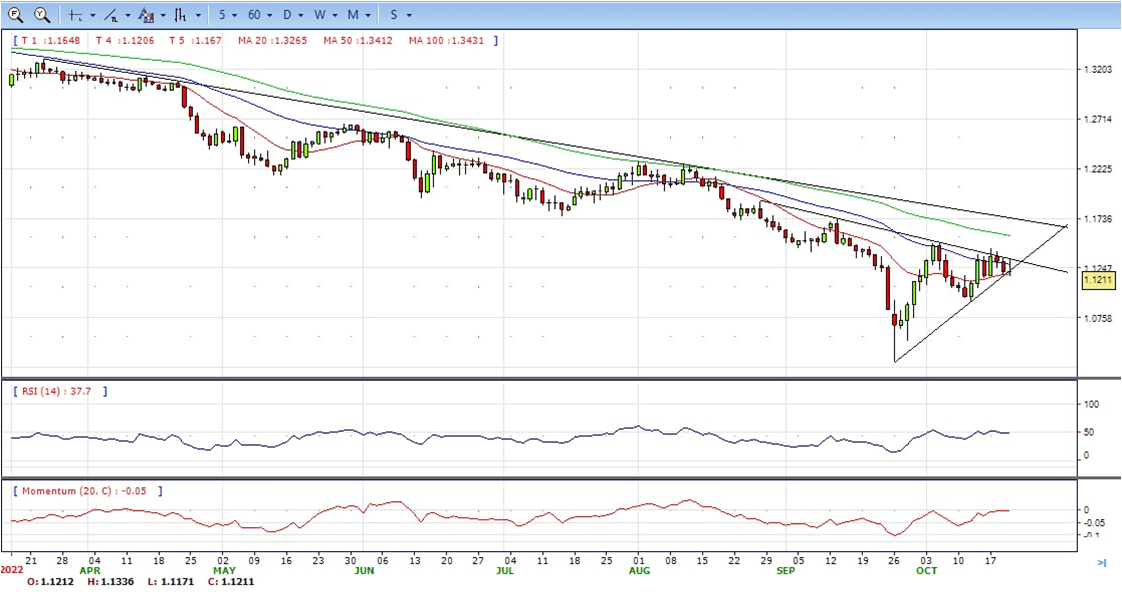
- The GBP/USD offers neutral stance in daily chart. Cable now is stabilizing between 20 and 50 SMA, indicating neutral strength in short term. However, the 20 SMA continued developing below longer ones despite it continued developing flat and upside still capped by the long-term bearish trend line, suggesting bears not exhausted yet. On upside, The immediate resistance is 1.1340 with a break above it exposing to 1.1500.
- Technical readings in the daily chart support neutral stances. RSI indicator stabilized around 49, while the Momentum indicator stabilized near the midline, suggesting directionless potentials. On downside, the immediate support is 1.1180, unable to defend this level will resume the decline to 1.1050.

CDO TRADER
CDO TRADER, our cutting-edge trading platform, follows the technology from the forefront with new features added continuously. Moreover, CDO TRADER is now available for Android and iOS! So it allows you to trade on the go!
XAU/USD
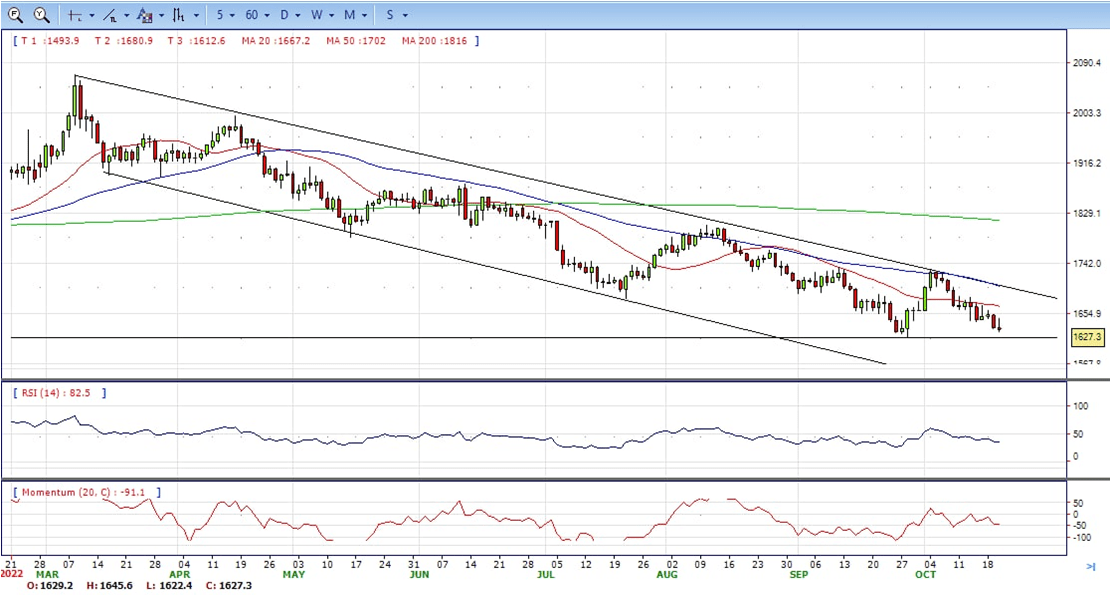
- The gold price has moved back to downside on the day to print around $1,627 at the time of writing, having travelled between a low of $1,622.4 and $1,645.6 thus far, continued under the sell pressure despite the US dollar eased, still bearish in the daily chart.
- The American Dollar started Thursday on the back foot but trimmed intraday losses and finished the day little changed against most major rivals. The greenback eased at the beginning of the day on the back of stable US Treasury yields and firmer equities. Wall Street rallied ahead of the opening following solid earning reports, but US indexes finished the day in the red as bond yields soared to their highest since 2008.
- Another risk-off factor came from the United Kingdom. Prime Minister Liz Truss resigned after 44 days in office, after failing to order the financial system, but instead triggering more chaos. The 1922 Committee announced they would start the Conservative Party’s leadership on Monday, October 24.
- Gold price stabilized around 1627, down for the day and bearish in the daily chart. The gold price stabilized below 20 and 50 SMA, suggesting bearish strength. Meanwhile, the 20 SMA continued developing far below longer ones despite it started turning flat, indicating bears not exhausted yet. On upside, the immediate resistance is 1645, break above this level will open the gate to extend the advance to 1670 area.
- From a technical perspective, the RSI indicator hold below the midline and stabilized around 35, suggesting bearish strength. The Momentum indicator struggled below the midline, suggests downward potentials. On downside, the immediate support is 1614, below this area may resume the decline to 1600.
MetaTrader 4
MT4 has user friendly interface that is providing simplicity and efficiency. The traders can perform trading strategies for different products like Forex and CFD. MetaTrader 4 has over 50 built-in indicators, also it’s the tool that predicts trends and defines the appropriate entry and exit points.

USD/JPY
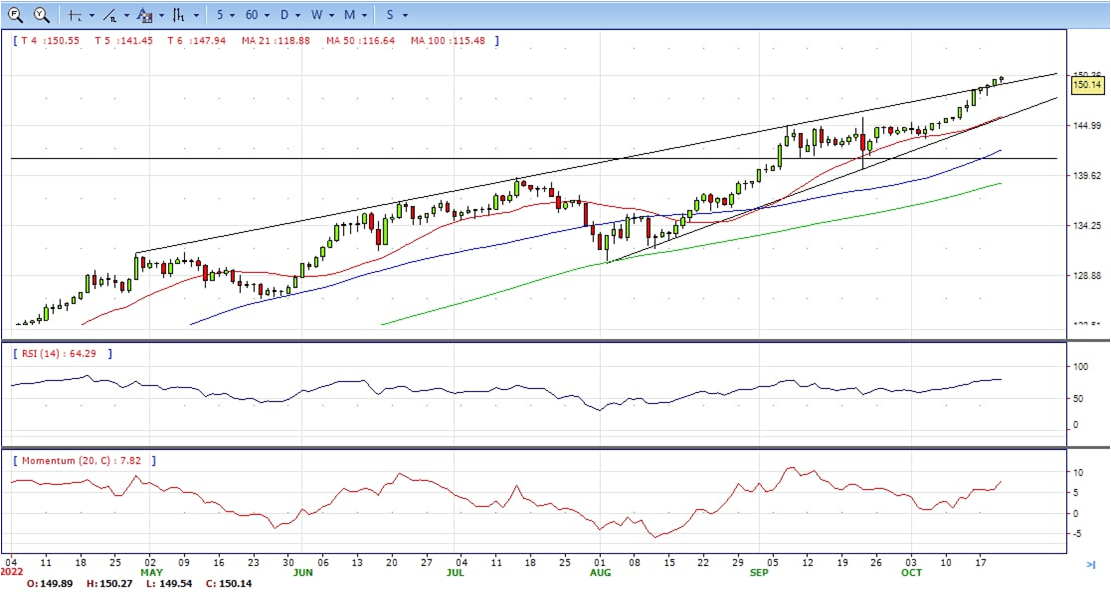
- USD/JPY edges up during the New York session, following a firmly break above the 150.00 figure despite BoJ intervention lurks. It ended the day around 150.14, still bullish in the daily chart.
- During the Asian session, Japanese authorities ramped up their verbal intervention in the markets as the USD/JPY surpassed the 150.00 figure. Additionally, the 10-year JGB’s yield shot through the upper band imposed by the BoJ, above 0.25%, propelling the central bank to buy $667 million in government debt to put a lid on the 10-year JGB yield rise.
- Aside from this, the US Department of Labor revealed that claims for unemployment for the week ending on October 15 rose by 214K less than the 228K estimated by the street’s economists, flashing the labor market tightness. At the same time, the Philadelphia Fed reported its Business Conditions Index for October, which came at -8.7, below the -5.0 forecasts, but better than September’s -9.9 number.
- The USD/JPY pair stabilized around 150.14, up for the day and bullish in the daily chart. The price still maintains the upward slope and stabilized above all main SMAs, suggests bullish strength. Meanwhile, 20 SMA continued accelerating north and developing above longer ones, indicating bulls not exhausted in the long term. On upside, overcome 151.00 may encourage bulls to challenge 152.00, break above that level will open the gate to 153.00.
- Technical indicators suggest the bullish strength. RSI stabilized around 80, while the Momentum indicator continued developing above the midline, suggests upward potentials. On downside, the immediate support is 149.00, break below this level will open the gate to 148.00 area.
DJI
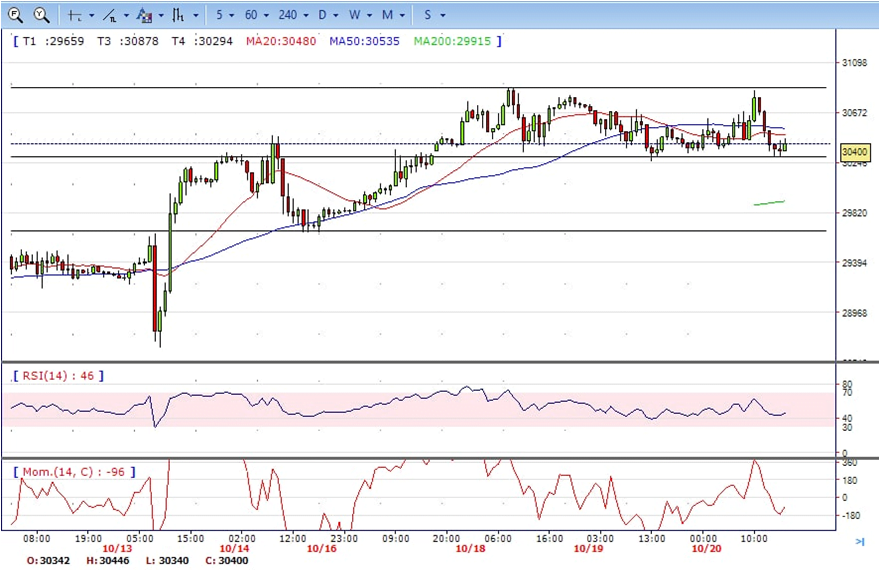
- DJI still consolidated in the familiar range, retreated from the intraday high 30856 area to 30287 daily low. It recovered some losses and ended the day at around 30400, down for the day and bearish in the hourly chart. It stabilized below all main SMAs, suggests bearish strength. Meanwhile, 20 SMA continued accelerating south and heading towards longer one, suggests bears not exhausted yet. On upside, overcome 30880 may encourage bulls to challenge 31100, break above this level will open the gate to 31260.
- Technical indicators suggest the neutral to bearish strength. RSI stabilized around 46, while the Momentum indicator stabilized below the midline, suggests downward potentials. On downside, the immediate support is 30250, break below this level will open the gate for more decline to 30000 area.
BRENT
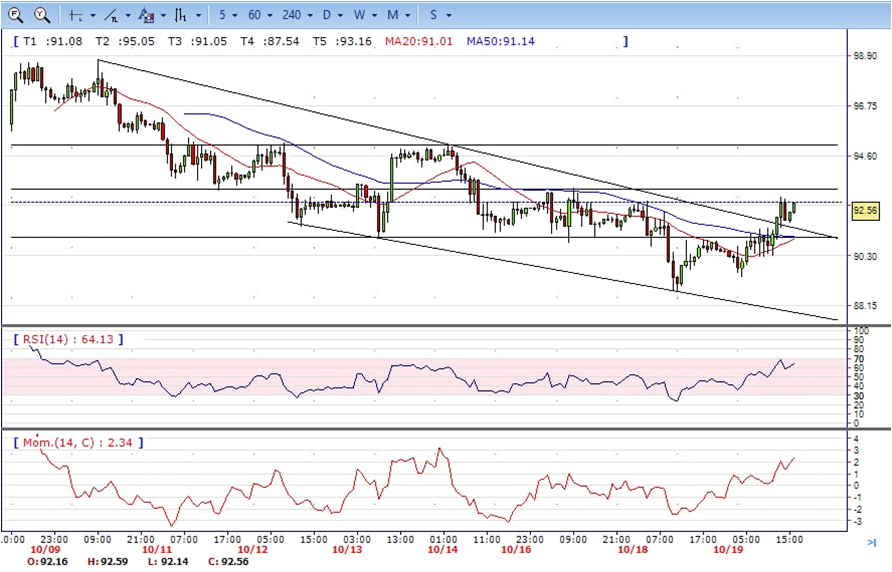
- Brent continued the advance in the first half of the day, jumped to intraday high 94.77, but failed to hold the gains and retreated to the familiar range, ended Thursday at around 92.70, unchanged for the day and neutral in the hourly chart. The price stabilized between 20 and 50 SMA, suggests neutral strength in short term. Meanwhile, the 20 SMA continued accelerating north and far above longer ones, indicating bulls not exhausted yet. On upside, overcome 93.20 may encourage bulls to challenge 95.00, break above this level will open the gate to 96.50.
- Technical indicators suggest the neutral to bearish movement, hovering near the midline. RSI stabilized around 50, while the Momentum indicator stabilized in negative territory, suggests downward potentials. On downside, the immediate support is 92.00, break below this level will open the gate for more decline to 89.30 area.
Contact Us
Please, fill the form to get an assistance.


