27/06/2023 Daily Reports
- After two consecutive daily retracements, including the drop to weekly lows near 1.0840, the Euro (EUR) regains poise and manages to leave behind the key 1.0900 barrier vs. the US Dollar, lifting a the same time EUR/USD to daily peaks around 1.0920 on Monday.
- The pair’s so far positive start to the week comes in line with the renewed selling bias surrounding the Greenback, which has caused the USD Index (DXY) to retreat from its multi-day highs above 103.00 seen towards the end of last week. On the broader macroeconomic front, the potential next steps by both the Federal Reserve and the European Central Bank in normalizing their monetary policies are the subject of ongoing debate, against the backdrop of increasing speculation of an economic slowdown on both sides of the Atlantic.
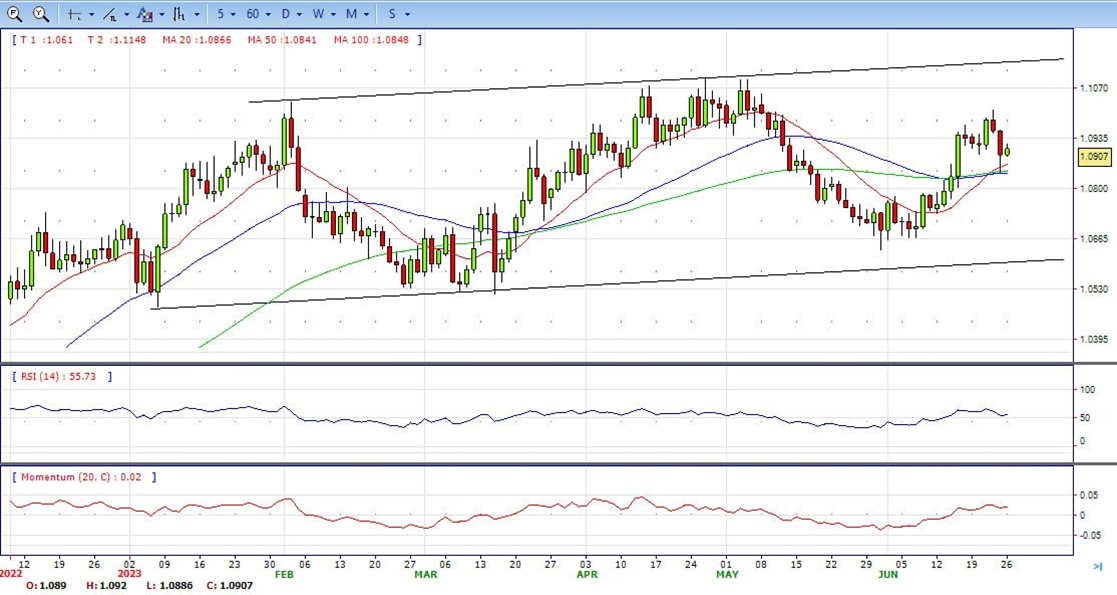
- The EUR/USD pair is trading near the 1.0907, up for the day with bullish stance in daily chart. The pair stabilized above all main SMAs, indicates bullish strength. Meanwhile, the 20 SMA continued accelerating north and heading towards 50 and 200 SMA, suggests bulls not exhausted yet. On upside, the immediate resistance is 1.1010, break above this level will extend the advance to 1.1100.
- Technical readings in the daily chart support the bullish stance. The RSI indicator stabilizes around 56. The Momentum indicator holds above the midline, indicating upward potentials. On downside, the immediate support is 1.0840 and below this level will open the gate to 1.0800.
- GBP/USD climbs after dropping to a last week’s low of 1.2685, surpassing the 1.2700 figure amidst a risk-off impulse and broad US Dollar weakness across the board. The previous week’s BoE 50 bps rate hike weakened the Pound Sterling on fears that higher rates could spur a recession in the UK. Nevertheless, the GBP/USD clings to its 0.03% gains, trading at 1.2717.
- The GBP/USD is clinging to its gains as the greenback weakens on risk aversion. A light economic calendar in the US left traders adrift to last week’s data and Fed speakers hitting the wires during the weekend. The New York Fed President John Williams noted that “restoring price stability is of paramount importance because it is the foundation of sustained economic and financial stability. Price stability is not an either/or, it’s a must have.”
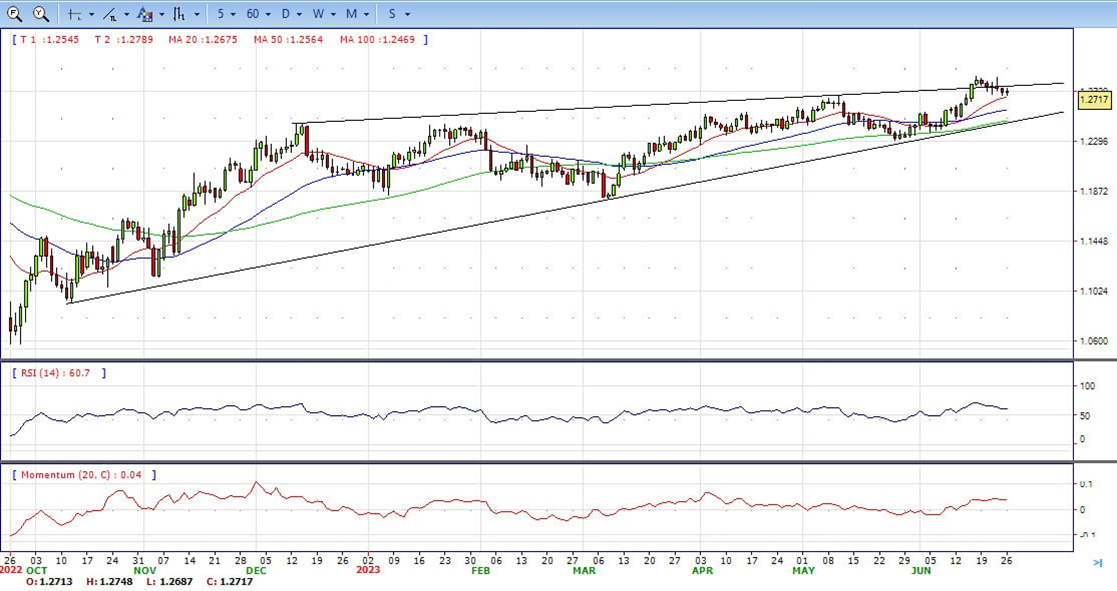
- The GBP/USD offers bullish stance in daily chart. Cable stabilizes above 20 and 50 SMA, indicating bullish strength in short term. Meanwhile, the 20 and 50 SMA started turning flat but continued developing above longer ones, suggests bulls not exhausted yet. On upside, the immediate resistance is 1.2850 with a break above it exposing to 1.3000.
- Technical readings in the daily chart support the bullish stances. RSI indicator stabilizes around 60, while the Momentum indicator stabilizes above the midline, suggesting upward potentials. On downside, the immediate support is 1.2680, unable to defend this level will resume the decline to 1.2550.


- Gold price has climbed marginally above the crucial resistance of $1,930.00 in the London session but failed to hold the gains and back to 1922 level. The precious metal is looking for stability above $1,930.00 as the US Dollar Index is facing pressure. The USD Index has corrected to near 102.63 as the investing community is mixed about further monetary policy by the Fed.
- The yellow metal is showing some resilience due to severe correction in the US Treasury yields. The 10-year US Treasury yields have dropped sharply to near 3.68%. Analysts at Rabobank expect the Fed to hike in July, a more moderate pace would imply skipping September and that would leave us with November as the meeting for the second hike.
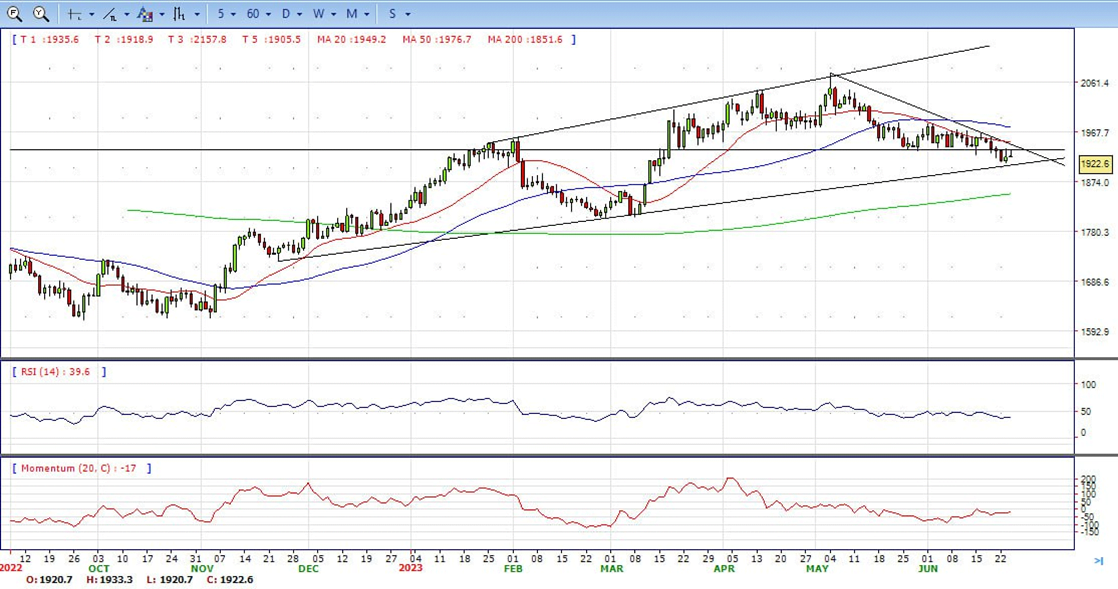
- Gold price stabilized around 1922, unchanged for the day and bearish in the daily chart. The gold price stabilizes below 20 SMA, suggesting bearish strength in short term. Meanwhile, the 20 SMA continued accelerating south and developing below 50 SMA, indicates bears not exhausted yet. On upside, the immediate resistance is 1938, break above this level will open the gate for more advance to 1960 area.
- From a technical perspective, the RSI indicator holds below the midline and stabilizes around 39, on a bearish strength. While the Momentum indicator also stabilized in the negative territory, suggests downward potentials. On downside, the immediate support is 1900, below this area may resume the decline to 1885.


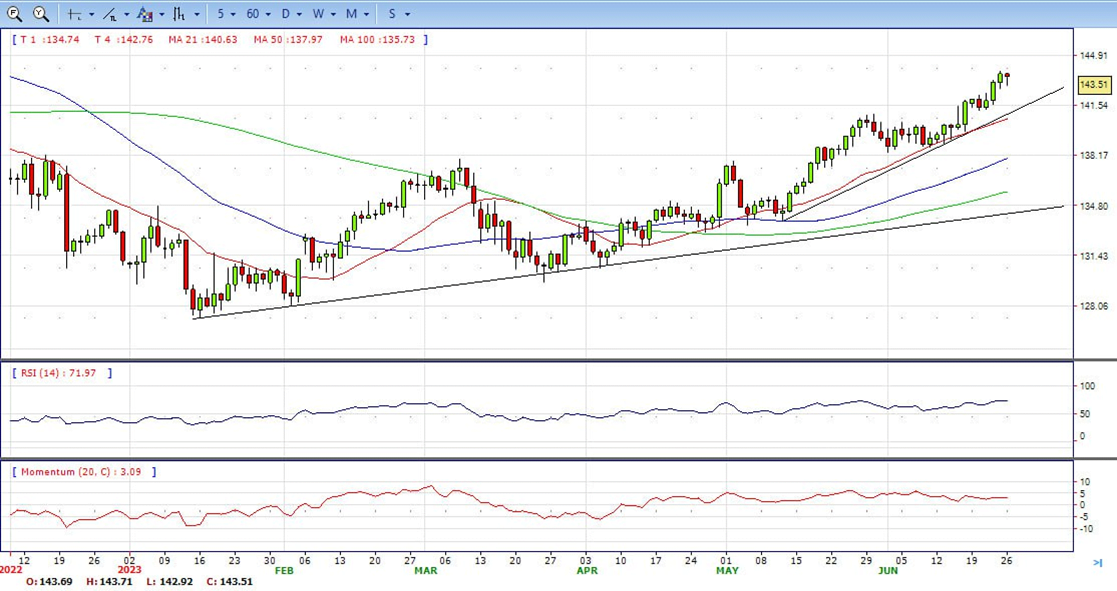
- USD/JPY stays firm at around the 143.50s area after diving towards a daily low of 142.93 on renewed concerns of a global economic slowdown amidst over-the-weekend geopolitical events weighed on investors’ mood. At the time of writing, the USD/JPY exchanges hand at 143.51, down 0.15%.
- US equities shifted negatively, while the Japanese Yen strengthened on Japanese authorities’ comments regarding excessive currency moves. A light Monday economic calendar in the United States, with the release of the Dallas Fed Manufacturing Index in June plunging to -23.2, showed some improvement but remained in recessionary territory. Although it continues to contract, it was the most significant advance in three months.
- The USD/JPY pair stabilized around 143.50, down for the day and bullish in the daily chart. The price stabilizes above 20 and 50 SMA, suggests bullish strength in short term. Meanwhile, 20 SMA continued accelerating north and developing above longer ones, indicating bulls not exhausted. On upside, overcome 144.00 may encourage bulls to challenge 145.50, break above that level will open the gate to 147.00.
- Technical indicators suggest the bullish strength. RSI stabilizes around 70, while the Momentum indicator stabilizes above the midline, suggests upward potentials. On downside, the immediate support is 142.60, break below this level will open the gate to 141.20 area.
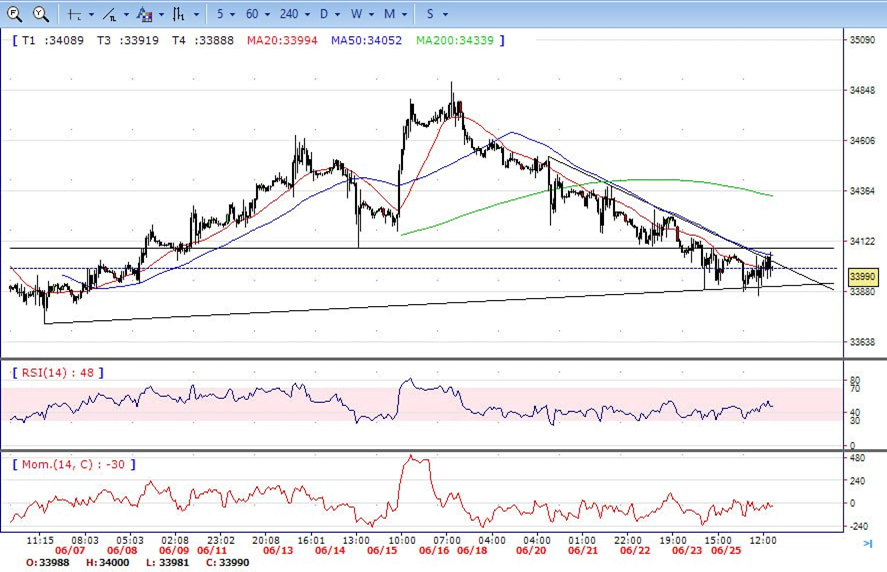
- DJI consolidated in the familiar range on Monday, traded from intraday high 34060 level to low 33857 and ended the day around 34000, between 50 and 200 SMA, suggests neutral strength. Meanwhile, 20 SMA continued accelerating south and developing below longer ones, suggests bears not exhausted yet. On upside, overcome 34100 may encourage bulls to challenge 34400, break above that level will open the gate to 34620.
- Technical indicators suggest the bearish movement. RSI stabilizes around 48, while the Momentum indicator stabilizes below the midline, suggests downward potentials. On downside, the immediately support is 33850, break below this level will open the gate for more decline to 33730 area.
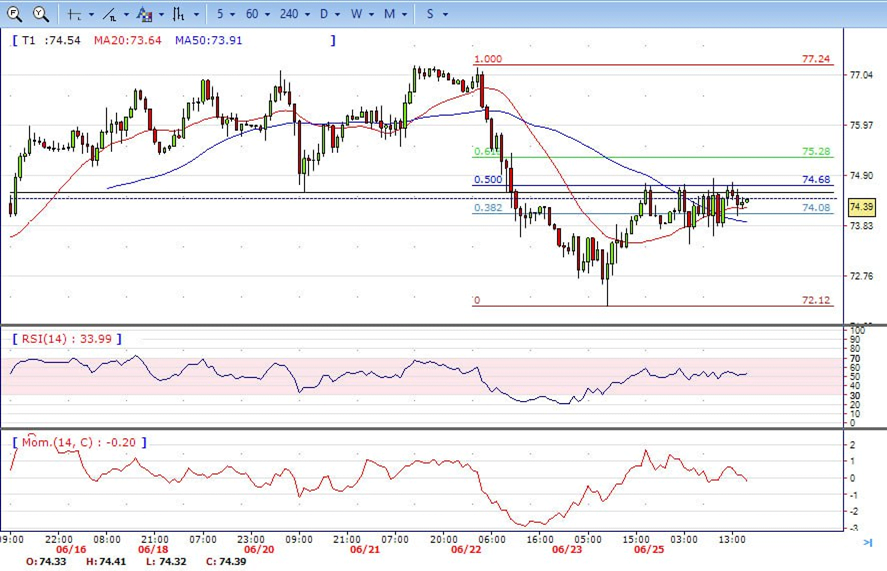
- Brent consolidated in the familiar range on Monday, traded from intraday high 74.84 level to low 73.43 and ended the day around 74.40, unchanged up for the day and stabilized above 20 SMA, indicates bullish sign in the hourly chart. Meanwhile, the 20 SMA started turning flat but continued developing above longer ones, indicates bulls not exhausted yet. On upside, overcome 75.00 may encourage bulls to challenge 75.80, break above that level will open the gate to 77.25.
- Technical indicators suggest bullish movement, hovering above the midline. RSI stabilizes at 52, while the Momentum indicator stabilizes near the midline, suggests directionless potentials. On downside, the immediately support is 73.40, break below this level will open the gate for more decline to 72.10 area.