

Daily Market News Brief 16/07/26
- President Trump delivered a rare wartime primetime address from the White House East Room Thursday night, but the speech focused largely on election-related claims rather than the escalating conflict with Iran. He barely mentioned the war, saying “We have the strongest and most powerful military by far anywhere in the world. I built it during my first term, and unfortunately, we’re forced to use it now,” and adding that the United States is “winning big in Iran, and you will see the fruits of that labor very, very shortly” — his only reference to the conflict, even as strikes have intensified throughout the week following the total breakdown of the ceasefire agreement.
- The speech came at a moment of sharp escalation: the US military said Thursday it launched a wave of airstrikes for the sixth consecutive night, and Trump is reportedly receiving options for expanding the US military operation in Iran as he weighs next steps. Earlier in the week, Trump announced that a naval blockade would be reimposed on Iranian ships in the Strait of Hormuz, with the US acting as the waterway’s “guardian.” Domestic support remains weak
- US stocks fell Thursday, with the Nasdaq Composite down 1.5% as chip stocks came under pressure for a second day amid escalation in the US-Iran war. Alphabet shares sank over 4% after Bloomberg reported the company is behind schedule delivering its Gemini 3.5 Pro AI model. Semiconductor stocks slid after TSMC’s robust earnings failed to impress, with AI memory names SanDisk and Western Digital among the hardest hit.
- The DAX fell 0.21% to 24,946 on July 16, after closing down 0.59% at 25,000 on Wednesday, led by losses in Infineon (-5.45%), BASF and Bayer, as investors weighed corporate earnings and Middle East tensions. ASML raised its guidance and announced capacity expansion after strong Q2 results, while Richemont’s results lifted luxury shares.
- The Nikkei 225 tumbled 1,915.97 points (2.79%) on July 16 to close at 66,835.54, with selling concentrated in semiconductor stocks. Major decliners included Kioxia (-8.7%), Tokyo Electron (-5.2%), SoftBank Group (-5.9%), and Advantest (-5.1%), while US producer prices unexpectedly declined in June.
- Brent September futures settled at $84.95 as US forces carried out another round of strikes against Tehran and Washington reinstated its naval blockade of Iranian ports near the Strait of Hormuz. Prices had earlier topped $86 after Iranian attacks damaged two ADNOC tankers in the strait, and EIA data showed US crude inventories fell 1.7 million barrels last week.
Account Opening
Open A Live Account
CDO has wide range of tools, professional and friendly support for clients to achieve their financial markets trading goals. Open a live account now to enjoy this experience with virtual deposit.


Forex Mobile & Desktop App
CDO TRADER
CDO TRADER, our cutting-edge trading platform, follows the technology from the forefront with new features added continuously. Moreover, CDO TRADER is now available for Android and iOS! So it allows you to trade on the go!


Support Level : 1.1380 - 1.1300 - 1.1200 Resistance Level : 1.1482 - 1.1600 - 1.1680
EUR/USD
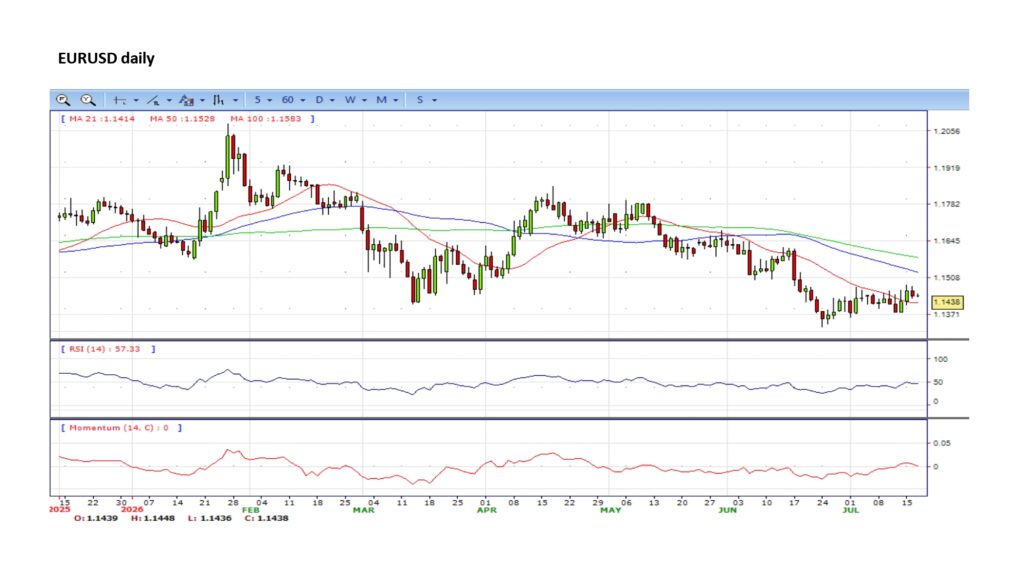
- EUR/USD trades lower near the 1.1440 area on Thursday, retreating around 0.2% as the US Dollar (USD) gains support from stronger-than-expected United States (US) labor market data.
- US Initial Jobless Claims fell to 208K in the week ending July 11, below expectations of 217K and the previous 216K. The figures indicate that layoffs remain limited, supporting the Greenback despite signs of softer consumer spending.
- In the Eurozone, investors await June inflation data. Core Harmonized Index of Consumer Prices (HICP) inflation is expected to remain at 2.4% YoY and 0.2% MoM, while headline HICP is forecast to decline 0.1% on the month. A softer inflation reading could strengthen expectations of a less restrictive European Central Bank (ECB) policy stance and place additional pressure on the Euro.
- The EUR/USD pair is trading near 1.1440, down for the day and above 21 SMA, indicates bullish strength in short term. Meanwhile, the 50 and 100 SMA still pressure the market, suggests bears not exhausted yet. On upside, the immediate resistance is 1.1482, break above this level will extend the advance to 1.1600.
- Technical readings in the daily chart support the bearish stance. The RSI indicator stabilizes around 47. The Momentum indicator holds below the midline, indicating downward potentials. On downside, the immediate support is 1.1380 and below this level will open the gate to 1.1300.
Support Level: 1.3400 - 1.3300 - 1.3200 Resistance Level: 1.3550- 1.3650 - 1.3700
GBP/USD
- The Pound Sterling GBP/USD tumbles below 1.3500 on stronger Dollar. The Pound Sterling trims some of its Wednesday gains versus the US Dollar, down by over 0.48% following solid US data. The sell-off comes amid risk aversion and augments the safe-haven appeal of the Greenback.
- US Retail Sales in June increased 0.2% MoM, as expected. Gasoline prices eased from $4.61 in May to $4.18 in the last month, leaving consumers with free money for discretionary spending. Excluding gasoline and autos, Retail Sales expanded 0.4% MoM, down from 0.5%. Other US data showed that jobless claims for the week ending July 11 fell from 216K to 208K, below estimates for a 217K increase. On Wednesday, the Federal Reserve’s (Fed) Beige Book noted that the “employment rose on balance,” in July, with some districts “showing modest, moderate or solid gains.”
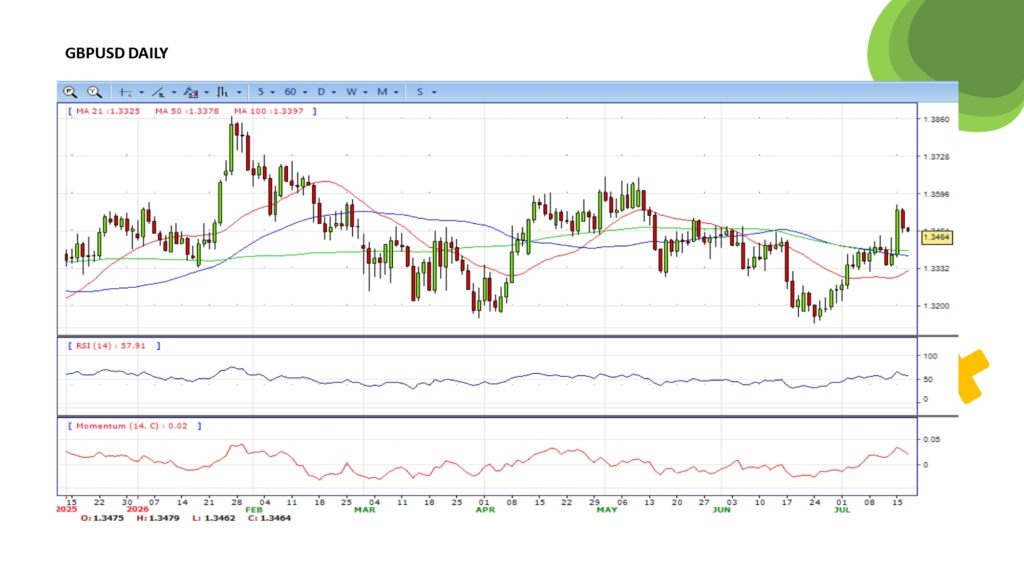
- The GBP/USD pair is trading near 1.3470, down for the day but still trades above 21 SMA, indicates bullish strength in short term. Meanwhile, the breakthrough of both 50 and 100 SMA provide bull signal. On upside, the immediate resistance is 1.3550, break above this level will extend the advance to 1.3650.
- Technical readings in the daily chart support the bullish stances. RSI indicator stabilizes around 58, while the Momentum indicator stabilizes above the midline, suggesting upward potentials. On downside, the immediate support is 1.3400, unable to defend this level will resume the decline to 1.3300.
Support Level : 3900 - 3700 - 3500 Resistance Level : 4180 - 4380 - 4520
XAU/USD
- Gold price drops over 1.80% as tensions between the US and Iran fuel fears of a possible Oil supply disruption, driving energy prices higher and potentially triggering another round of inflation.
- The effects of the Middle East conflict are well reflected by the strength of the US Dollar. The Greenback is up some 0.24%, as measured by the US Dollar Index (DXY). The DXY, which tracks the buck’s value against its peers, is at 100.74, still shy of revisiting the 101.00 mark.
- US jobs data was also solid, as Initial Jobless Claims for the week ending July 11 came at 208K, beneath forecasts of a 217K increase. The Fed’s Beige Book acknowledged that the labour market is strong, with some districts showing “modest, moderate or solid gains.”
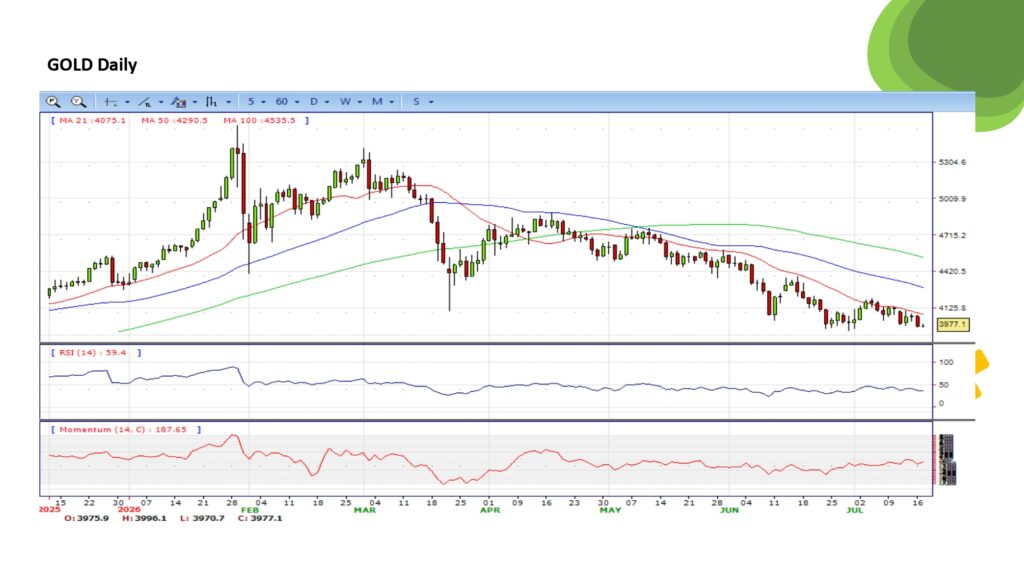
- The XAU/USD pair is trading near 3980, down for the day. The pair stabilized below 21 SMA, indicates bearish strength in short term. Meanwhile, the 21 SMA continued developing below longer ones, suggests downward potentials. On upside, the immediate resistance is 4180, break above this level will extend the advance to 4380.
- From a technical perspective, the RSI indicator holds below the midline and stabilizes around 38, on a bearish stance. While the Momentum indicator stabilized below the midline, suggests downward potentials. On downside, the immediate support is 3900, below this area may resume the decline to 3700.
Support Level : 160.00 – 158.00– 155.50 Resistance Level : 163.00 – 164.00 – 165.00
USD/JPY
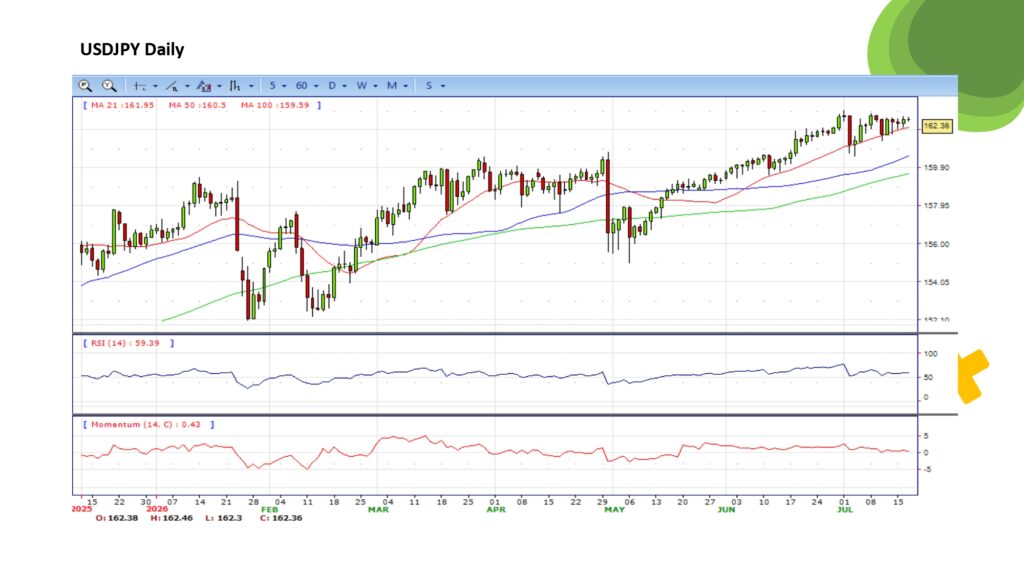
- The Japanese Yen (JPY) holds modest gains against the US Dollar (USD) on Thursday following better-than-expected US inflation data. At the time of writing, USD/JPY trades around 162.40.
- US Retail Sales rose 0.2% MoM in June, matching expectations but slowing from May’s 1.0% increase. The Retail Sales Control Group advanced 0.5%, also in line with forecasts but below the previous 0.8%, suggesting that consumption momentum moderated. US Initial Jobless Claims fell to 208K in the week ending July 11, below expectations of 217K and the previous 216K. The figures indicate that layoffs remain limited, supporting the Greenback despite signs of softer consumer spending.
- The USD/JPY pair is trading near 162.40, slightly up for the day. The pair is above 21 SMA also well about 50 and 100 SMA, indicates bullish strength in short term. Meanwhile, the 21 SMA continued accelerating north and developing above longer ones, suggests bulls not exhausted yet. On upside, the immediate resistance is 163.00, break above this level will extend the advance to 164.00.
- Technically RSI stabilizes around 60, while the Momentum indicator stabilizes above the middle line, suggests upward potentials. On downside, the immediate support is 160.00, break below this level will open the gate to 158.00 area.