07/10/2022 Daily Reports
- The EUR/USD dropped further after the beginning of the American session and bottomed at 0.9790, the lowest level in two days. The intraday bias is bearish with the US dollar looking stronger ahead of the NFP.
- On Thursday, economic data released in the US showed a larger-than-expected increase in Initial Jobless Claims to the highest level in five weeks. Despite the numbers, the dollar remains firm. Fed talk about the need to continue rising rates, keeps giving the dollar support.
- The key drivers of dollar’s strength on Thursday are US yields. The US 10-year yield rose to the highest level in a week at 3.84% and the 2-year climbed above 4.20%. The DXY is up by 0.90%, at 111.20.
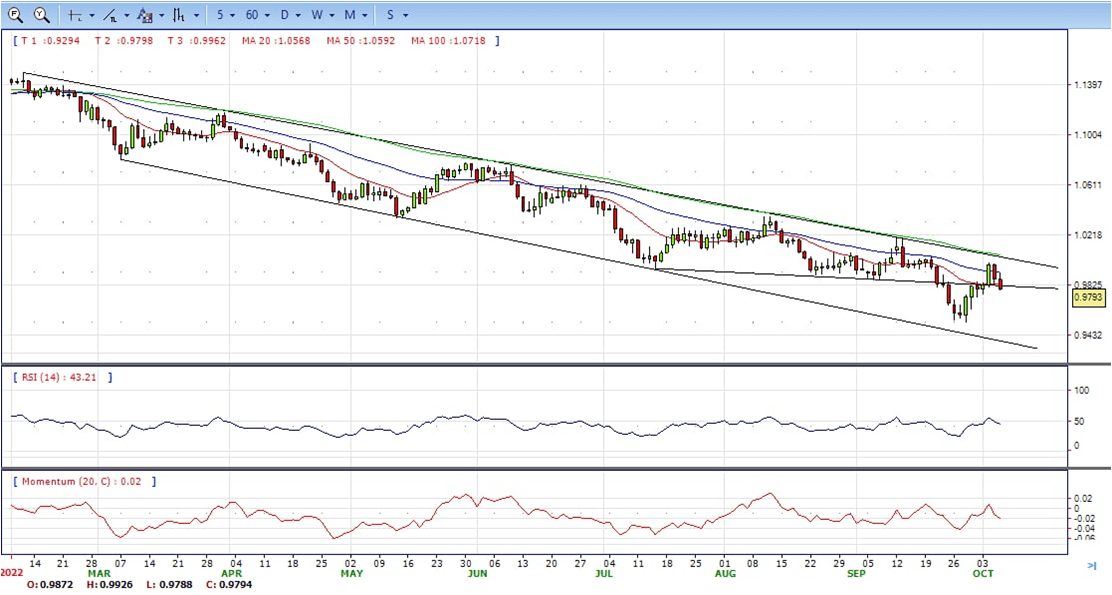
- The EUR/USD pair is trading near the 0.9800, down for the day with the neutral stance in daily chart. The pair stabilized below 20 and 50 SMA, indicates bearish strength. Meanwhile, the 20 SMA continued developing far below longer ones despite it started turning flat, suggests bears not exhausted yet. On upside, the immediate resistance is 0.9920, break above this level will extend the advance to 1.0000.
- Technical readings in the daily chart support the bearish stances. The RSI indicators hovering below the midlines and stabilized around 44. The Momentum indicator stabilized in the negative territory, indicating downward potentials. On downside, the immediate support is 0.9750 and below this level will open the gate to 0.9630.
- The GBP/USD extends its losses to two-consecutive days after snapping six days of gains, which bolstered the major towards the 1.1500 area. The pair is trading at 1.1155 below its opening price by almost 1.30% after hitting a daily high of 1.1383.
- Data-wise, the US Department of Labor reported that unemployment claims increased, a positive sign for the Federal Reserve. Initial Jobless Claims for the week ending on October 1 rose by 219K, higher than the 203K estimated by analysts. The four-week moving average, which smooths volatile week-to-week results, was almost unchanged at 206.5K.
- On the UK’s front, businesses inflation expectations rose to 9.5% in September, from 8.4% in August, according to a Bank of England Survey on Thursday. Even though the Bank of England is expected to keep rates higher, Wells Fargo analysts expect further British pound weakness.
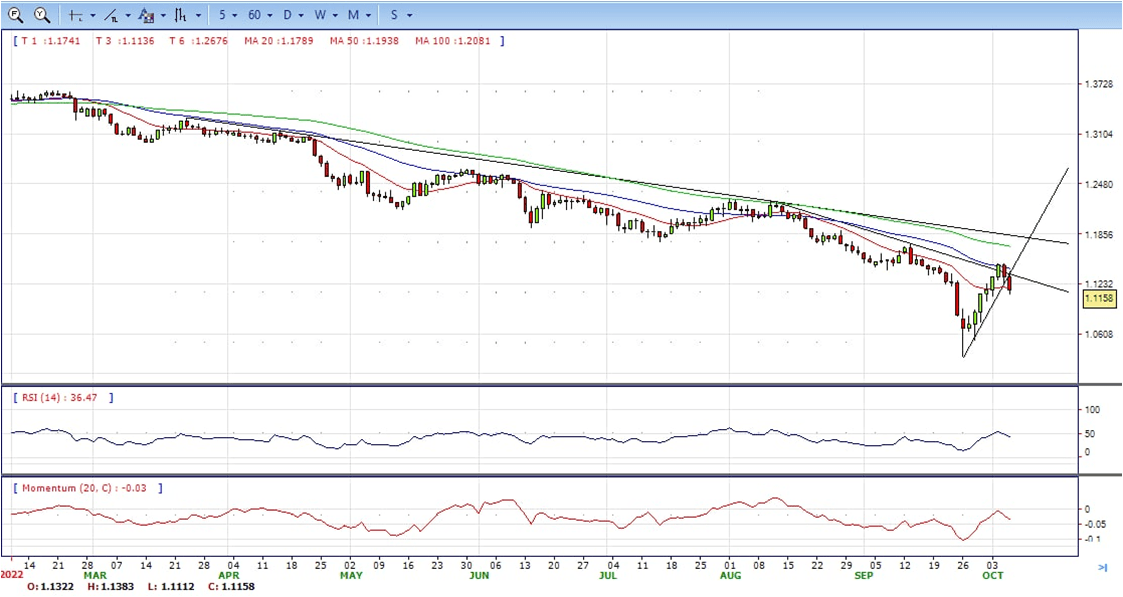
- The GBP/USD offers bearish stance in daily chart, it maintains the downward slope after hit 1.1383 high. Cable now is stabilizing below 20 and 50 SMA, indicating bearish strength in short term. Meanwhile, the 20 SMA continued developing below longer ones despite it started turning flat, suggesting bears not exhausted yet. On upside, The immediate resistance is 1.1280 with a break above it exposing to 1.1500.
- Technical readings in the daily chart support bearish stances. RSI indicator stabilized around 41, while the Momentum indicator stabilized below the midline, suggesting downward potentials. On downside, the immediate support is 1.1020, unable to defend this level will resume the decline to 1.0940.

- Gold struggles to gain any meaningful traction on Thursday and seesaws between tepid gains/minor losses through the early North American session. The XAU/USD is currently placed in neutral territory, around the $1,714 region as traders await a fresh catalyst before positioning for the next leg of a directional move.
- The US dollar edges higher for the second straight day and is looking to build on the overnight bounce from a two-week low, which, in turn, acts as a headwind for the dollar-denominated gold. The recent hawkish remarks by several Fed officials reinforced market expectations that the US central bank will continue to tighten its monetary policy at a faster pace to tame inflation. In fact, the markets have been pricing in another supersized 75 bps Fed rate hike move in November, which remains supportive of elevated US Treasury bond yields and continues to underpin the greenback.
- Market players, meanwhile, remain concerned about the economic headwinds stemming from rapidly rising borrowing costs. Adding to this, the risk of a further escalation in the Russia-Ukraine conflict takes its toll on the global risk sentiment. This is evident from a generally weaker tone around the equity markets, which is seen offering some support to the safe-haven gold. The mixed fundamental backdrop is holding back traders from placing aggressive bets around the XAU/USD.
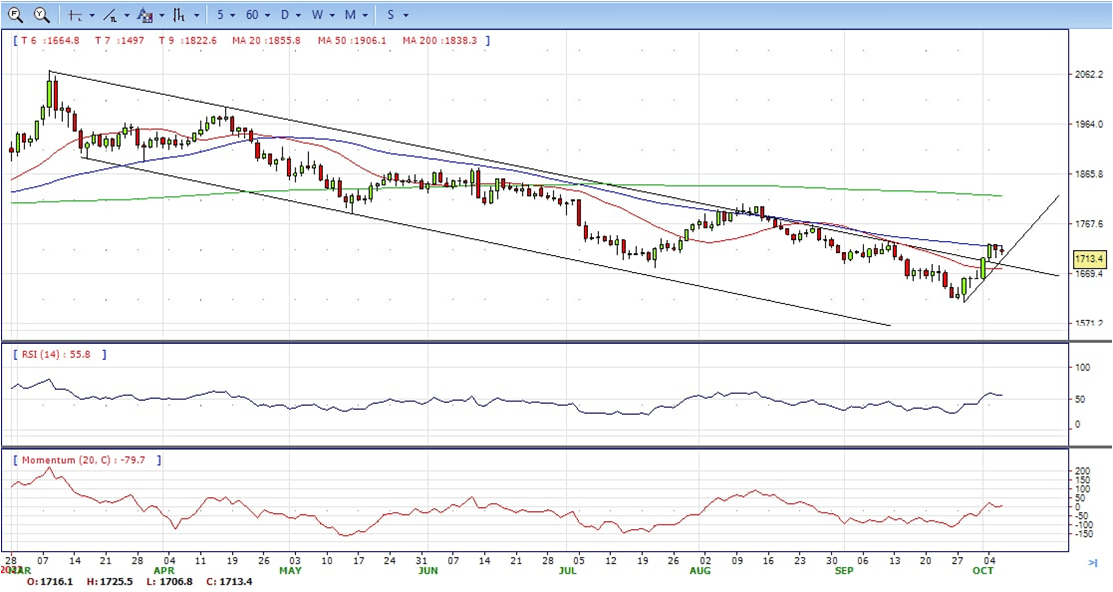
- Gold price stabilized around 1714, down for the day and bullish in the daily chart. The gold price stabilized above 20 SMA and now is challenging 50 SMA, suggesting bullish strength. Meanwhile, the 20 SMA continued developing far below longer ones despite it started turning flat, indicating bears not exhausted yet. On upside, the immediate resistance is 1730, break above this level will open the gate to extend the advance to 1745 area.
- From a technical perspective, the RSI indicator hold above the midline and stabilized around 56, suggesting bullish strength. The Momentum indicator struggled above the midline, suggests upward potentials. On downside, the immediate support is 1700, below this area may resume the decline to 1680.


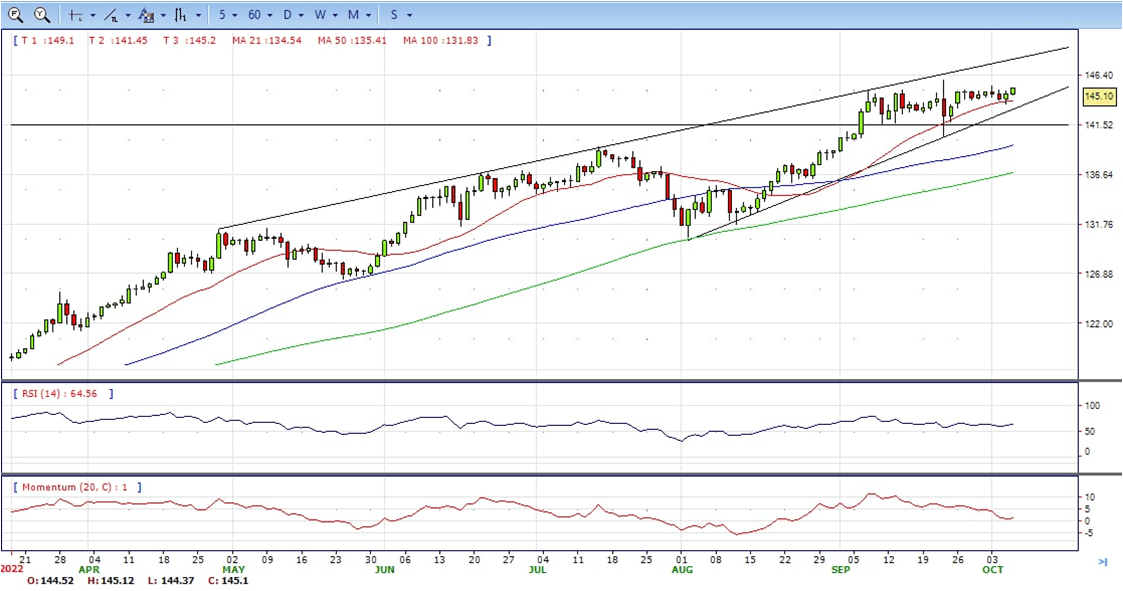
- The USD/JPY pair struggles to capitalize on the previous day’s bounce from the 143.50 area, or over a one-and-half-week low and oscillates in a narrow band on Thursday. The pair remains near the 145.00 psychological mark, bullish in the daily chart.
- A big divergence in the policy stance adopted by the Bank of Japan and other major central banks might continue to undermine the Japanese yen. In fact, the Japanese central bank has been lagging behind other major central banks in the process of policy normalisation and remains committed to continuing with its monetary easing. This, along with the emergence of some US dollar dip-buying, supports prospects for some meaningful upside for the USD/JPY pair.
- The recent hawkish remarks by several Fed officials reaffirmed expectations that the US central bank will tighten its monetary policy at a faster pace and continues to act as a tailwind for the USD. In fact, the markets have been pricing in the possibility of another supersized 75 bps Fed rate hike move in November. This remains supportive of elevated US Treasury bond yields, widening the US-Japan rate differential and adding credence to the constructive outlook.
- The USD/JPY pair stabilized around 145.080, up for the day and bullish in the daily chart. The price still maintains the upward slope and stabilized above all main SMAs, suggests bullish strength. Meanwhile, 20 SMA continued accelerating north and developing above longer ones, indicating bulls not exhausted in the long term. On upside, overcome 145.30 may encourage bulls to challenge 146.00, break above that level will open the gate to 147.00.
- Technical indicators suggest the bullish strength. RSI stabilized around 64, while the Momentum indicator continued developing above the midline, suggests upward potentials. On downside, the immediate support is 143.50, break below this level will open the gate to 142.50 area.


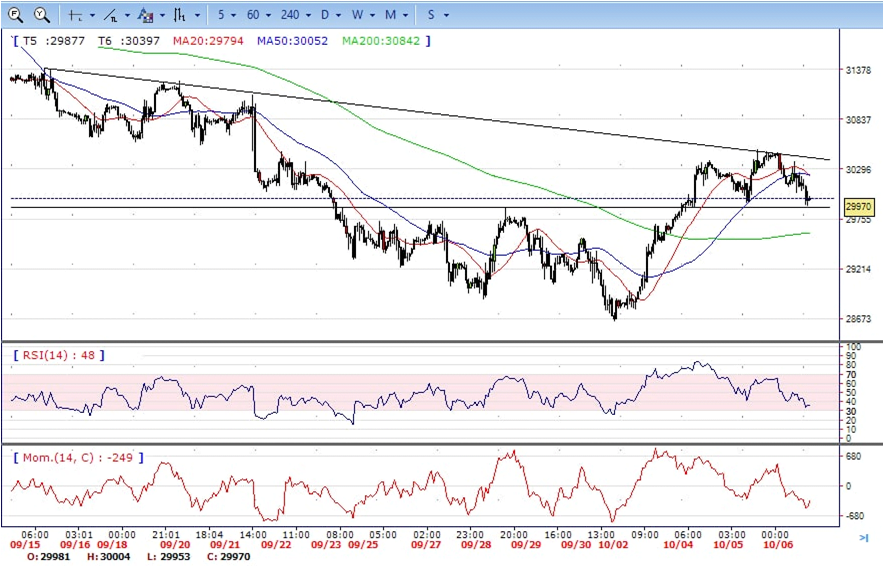
- DJI under the sell pressure, retreated from the intraday top 30480 area to intraday low 29900 region. it ended the day near the bottom, bearish in the hourly chart. It stabilized below all main SMAs, suggests bearish strength. Meanwhile, the 20 SMA continued accelerating south and heading towards longer ones, suggesting bears not exhausted yet. On upside, overcome 30240 may encourage bulls to challenge 30500, break above this level will open the gate to 30800.
- Technical indicators suggest the bearish strength. RSI stabilized around 35, while the Momentum indicator stabilized in negative territory, suggests downward potentials. On downside, the immediate support is 29900, break below this level will open the gate for more decline to 29700 area.
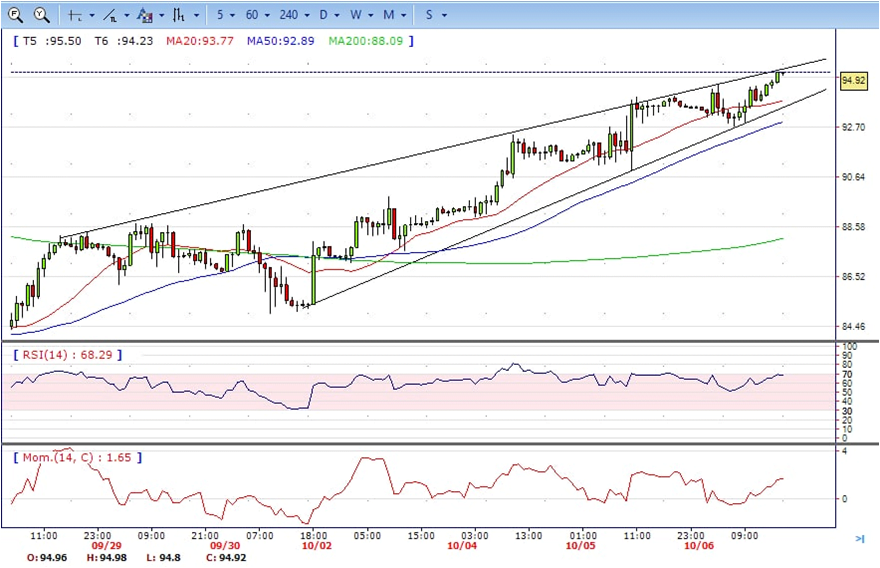
- Brent continued the advance, climbed from 92.70 low to 94.90 region. It hold near the top and ended Tuesday around 94.90, still bullish in the hourly chart. The price stabilized above 20 and 50 SMAs, suggests bullish strength in short term. Meanwhile, the 20 SMA continued accelerating north and developing above longer ones, indicating bulls not exhausted yet. On upside, overcome 95.60 may encourage bulls to challenge 97.00, break above this level will open the gate to 98.50.
- Technical indicators suggest the bullish movement, hovering above the midline. RSI stabilized around 68, while the Momentum indicator stabilized in positive territory, suggests upward potentials. On downside, the immediate support is 92.70, break below this level will open the gate for more decline to 91.00 area.