07/06/2023 Daily Reports
- EUR/USD witnessed a vertical fall after retreating from 1.0733 in the early New York session. The major currency pair has dropped to near 1.0670 after the release of weaker-than-anticipated German Factory Orders, Eurozone Retail Sales, and an upbeat US Dollar. The shared currency pair is expected to extend its downside further.
- The overall market mood is extremely cautious as weak US economic activities have raised hopes of a recession in the economy ahead. However, Goldman Sachs has shared distinct views about the US recession. The giant investment banking firm has slashed the probability of the US economy reporting recession to 25% from prior chances of 35%. The catalysts behind receding fears of the US recession are a strong labor market and improved business sentiment, as reported by Bloomberg.
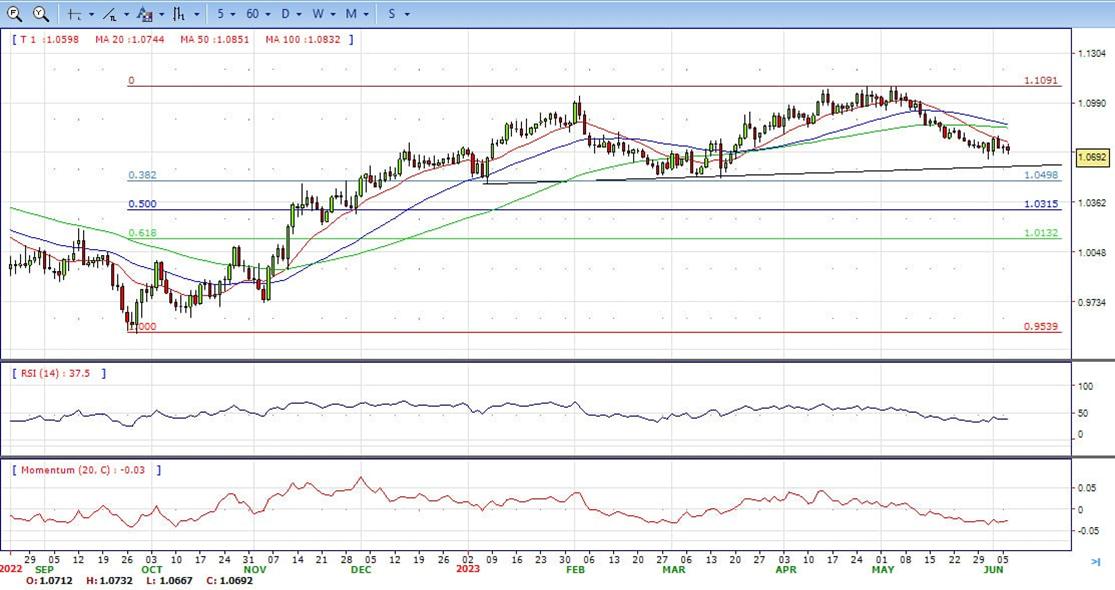
- The EUR/USD pair is trading near the 1.0692, slightly down for the day with bearish stance in daily chart. The pair stabilized below 20 and 50 SMA, indicates bearish strength. Meanwhile, the 20 SMA started turning south and heading towards 50 and 200 SMA, suggests bears not exhausted yet. On upside, the immediate resistance is 1.0780, break above this level will extend the advance to 1.0850.
- Technical readings in the daily chart support the bearish stance. The RSI indicator stabilizes around 38. The Momentum indicator holds below the midline, indicating bearish potentials. On downside, the immediate support is 1.0630 and below this level will open the gate to 1.0500.
- GBP/USD hovers around the 1.2420s area after traveling around a 60-pip range on Tuesday, capped by the lack of economic data from the US and mixed market sentiment. Factors linked to US bond yields and the greenback, weighed on the Pound Sterling, set to register back-to-back days of losses. At the time of writing, the GBP/USD is trading at 1.2420.
- Wall Street is trading mixed. Traders ignored data during the European session, as the construction PMI for the United Kingdom came in at 51.6 in May, exceeding the prior’s month reading of 51.1. Yet, the GBP/USD failed to gain traction as the US dollar rose. Meanwhile, the latest ISM PMIs release revealed that the economy is worsening as the manufacturing PMI contracted for the seven-straight month. Even though the services PMI expanded, the trend leans downward, increasing woes for a recession in the US.
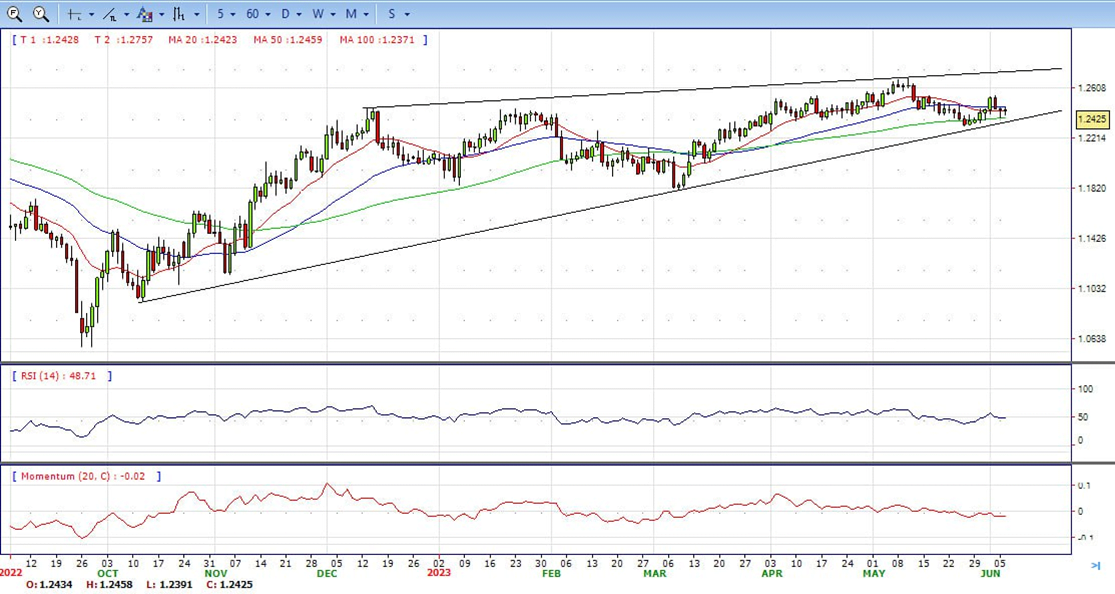
- The GBP/USD offers neutral stance in daily chart. Cable stabilizes near 20 and 50 SMA, indicating neutral strength in short term. Meanwhile, the 20 and 50 SMA started turning flat but continued developing above longer ones, suggests bulls not exhausted yet. On upside, the immediate resistance is 1.2550 with a break above it exposing to 1.2680.
- Technical readings in the daily chart support the neutral to bearish stances. RSI indicator stabilizes around 50, while the Momentum indicator stabilizes below the midline, suggesting downward potentials. On downside, the immediate support is 1.2370, unable to defend this level will resume the decline to 1.2300.


- Gold price retreats after hitting a daily high of $1966.34 as US bond yields edge higher, a headwind for the yellow metal. Investors sentiment is negative after reports of business activity in the US raised worries about a recession, underpinned the USD by last week’s Fed dovish comments, cushioned XAU/USD fall. At the time of writing, XAU/USD is trading at $1959.40, with losses of 0.10%.
- Sentiment improvement keeps the Gold price pressured. After dropping sharply on Monday, US Treasury bond yields recover, with the 10-year note rate at 3.708%, two basis points higher than the open, while US 10-year TIPS, a proxy for real yields, are at 1.521%, above the 1.50% mark, after Monday’s close below the latter.
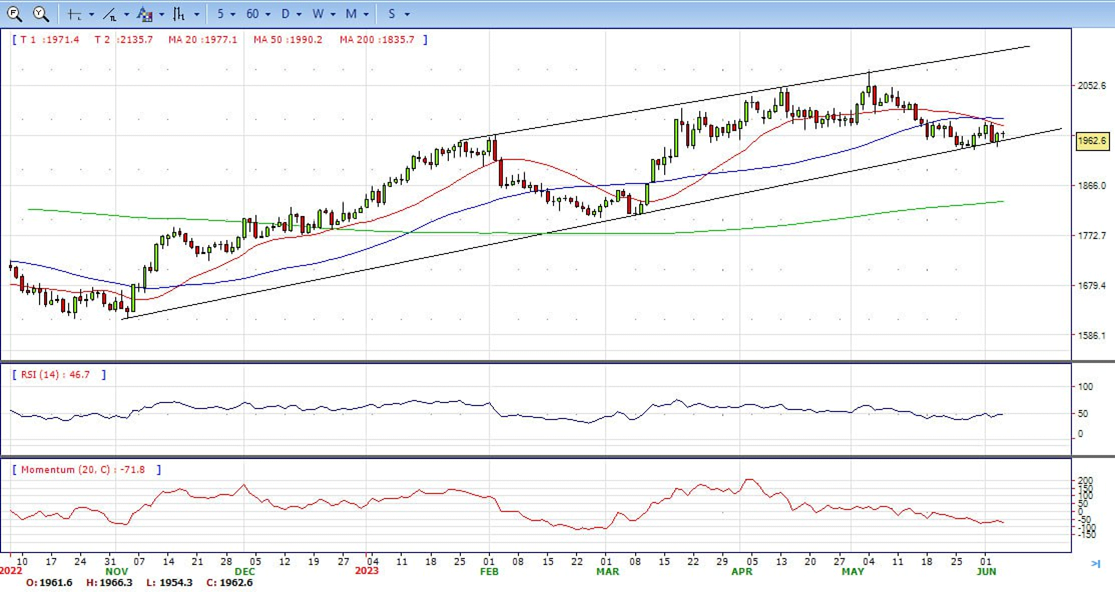
- Gold price stabilized around 1962, unchanged for the day and bearish in the daily chart. The gold price stabilizes below 20 SMA, suggesting bearish strength in short term. However, the 20 SMA started turning flat but continued developing far above 50 and 200 SMA, indicates bulls not exhausted yet. On upside, the immediate resistance is 1985, break above this level will open the gate for more advance to 2000 area.
- From a technical perspective, the RSI indicator holds near the mid-line and stabilizes around 47, on a bearish strength. The Momentum indicator hold in negative territory, suggests downward potentials. On downside, the immediate support is 1931, below this area may resume the decline to 1900.


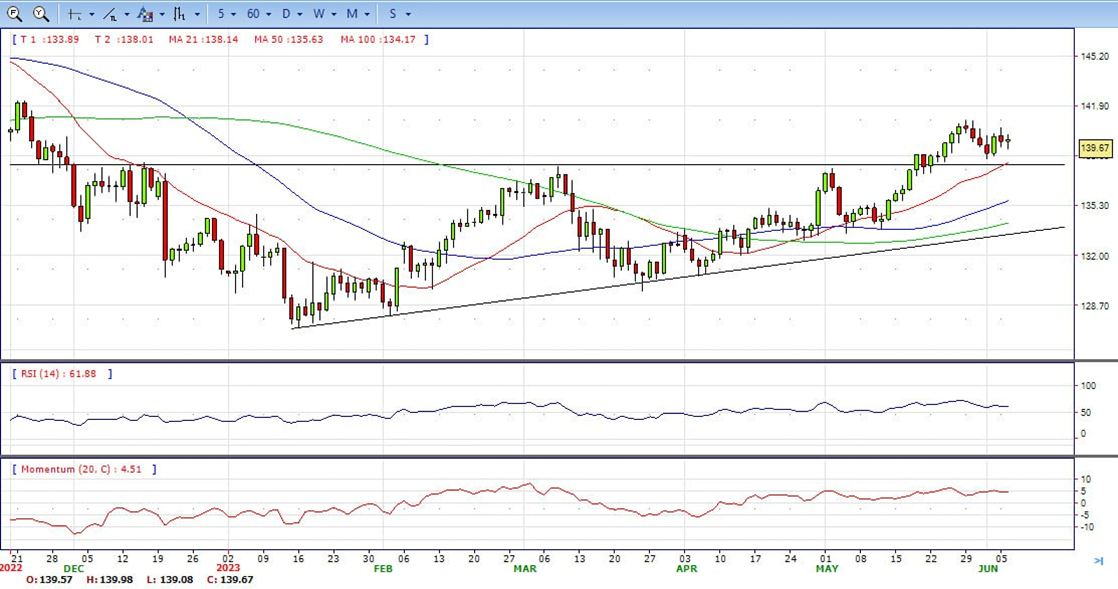
- The USD/JPY pair attracts some dip-buying in the vicinity of the 139.00 mark on Tuesday and stalls the overnight retracement slide from a multi-day peak. Spot prices build on the steady intraday ascent through the early North American session and climb to a fresh daily high, back closer to the 140.00 psychological mark. At the time of writing, the price is trading at 139.67, up 0.06% for the day.
- As investors look past Monday’s disappointing release of the US ISM Services PMI, the US Dollar gains positive traction and turns out to be a key factor acting as a tailwind for the USD/JPY pair. The intraday USD uptick could be attributed to an intraday uptick in the US Treasury bond yields, though is likely to remain limited in the wake of rising bets for an imminent pause in the Federal Reserve’s policy tightening cycle.
- The USD/JPY pair stabilized around 139.67, slightly up for the day and bullish in the daily chart. The price stabilizes above 20 and 50 SMA, suggests bullish strength in short term. Meanwhile, 20 SMA continued accelerating north and developing above longer ones, indicating bulls not exhausted. On upside, overcome 140.00 may encourage bulls to challenge 141.00, break above that level will open the gate to 142.30.
- Technical indicators suggest the bullish strength. RSI stabilizes around 61, while the Momentum indicator stabilizes above the midline, suggests upward potentials. On downside, the immediate support is 138.40, break below this level will open the gate to 137.20 area.
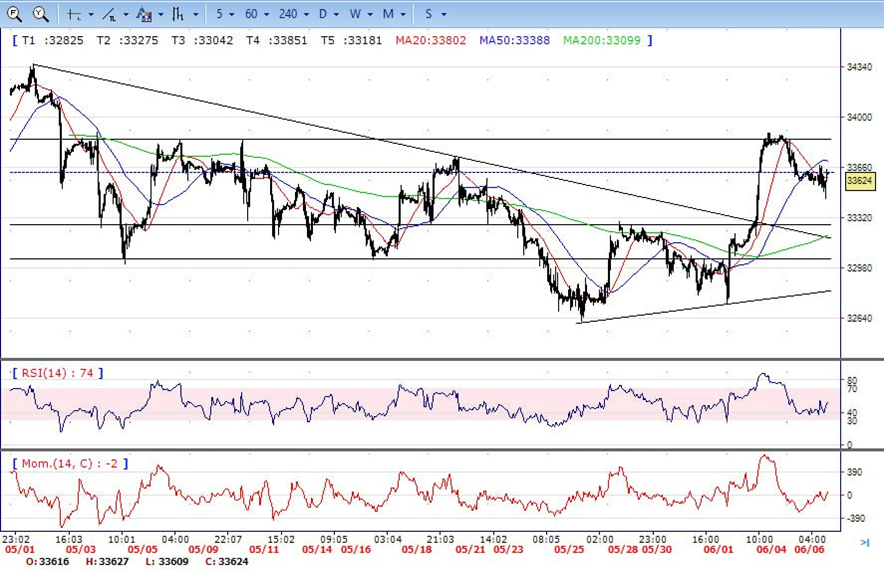
- DJI tumbled to fresh intraday low 33448 area on the first half of the day, but trimmed all the losses and jumped to 33630 level to ended the day, above 20 SMA, suggests bullish strength. Meanwhile, 20 SMA started turning flat but continued developing above 200 SMA, suggests bulls not exhausted yet. On upside, overcome 33900 may encourage bulls to challenge 34050, break above that level will open the gate to 34360.
- Technical indicators suggest the bullish movement. RSI stabilizes around 53, while the Momentum indicator stabilizes above the midline, suggests upward potentials. On downside, the immediately support is 33450, break below this level will open the gate for more decline to 33300 area.
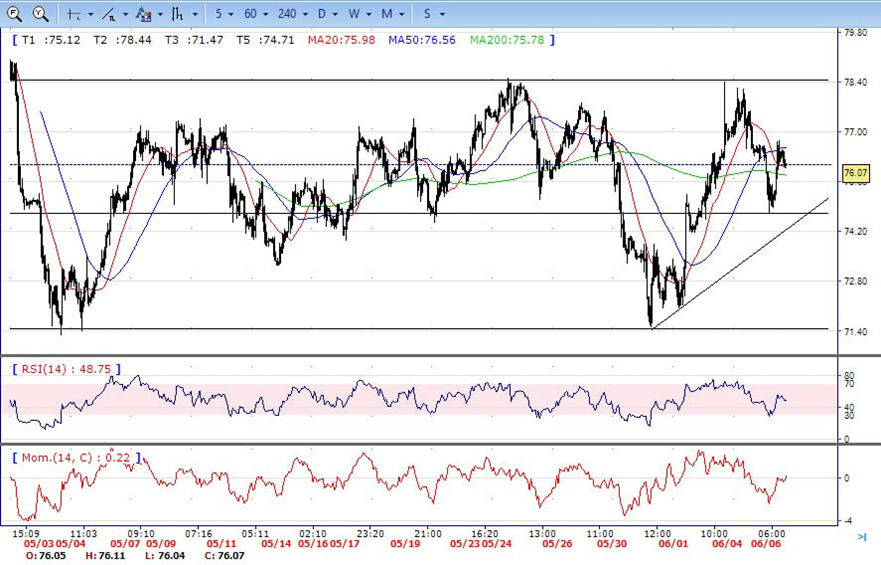
- Brent tumbled to fresh intraday low 74.72 area on the first half of the day, but trimmed all the losses and climbed to above 76.00 to ended the day, unchanged for the day and stabilized below 20 SMA, indicates bearish sign in the hourly chart. Meanwhile, the 20 SMA started turning south and heading towards longer ones, indicates bears not exhausted yet. On upside, overcome 78.50 may encourage bulls to challenge 80.30, break above that level will open the gate to 83.00.
- Technical indicators also suggest neutral to bearish movement, hovering below the midline. RSI stabilizes at 46, while the Momentum indicator stabilizes near the midline, suggests directionless potentials. On downside, the immediately support is 74.70, break below this level will open the gate for more decline to 73.20 area.