05/04/2023 Daily Reports
- The EUR/USD edges above the 1.0900 figure for the second consecutive day after data from the US shifted expectations that the US Fed would pause its tightening cycle. At the time of writing, the EUR/USD is trading at 1.0955 after hitting a low of 1.0882.
- Sentiment shifted sour as of late after a round of labor market data in the US has shown signs of cooling down. Job openings in February, reported in the JOLTs reports, dropped from 10.4 million to 9.931 million, a drop of 32,000. This could be a prelude that the labor market is cooling. Further data will be revealed during the week, with ADP Employment figures shown on Wednesday, followed by Initial Jobless Claims and the US Nonfarm Payrolls report.
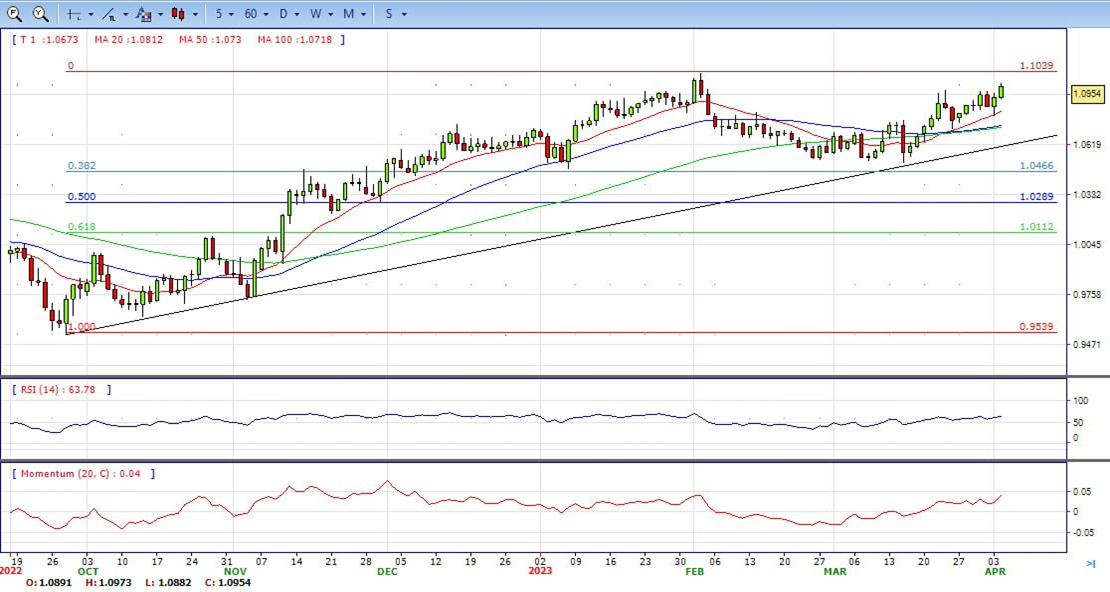
- The EUR/USD pair is trading near the 1.0900, up for the day with bullish stance in daily chart. The pair stabilized above 20 and 50 SMA, indicates bullish strength. Meanwhile, the 20 SMA continued accelerating north and heading towards 50 and 200 SMA, suggests bulls not exhausted yet. On upside, the immediate resistance is 1.0980, break above this level will extend the advance to 1.1030.
- Technical readings in the daily chart support the bullish stance. The RSI indicator stabilizes around 63. The Momentum indicator holds above the midline, indicating bullish potentials. On downside, the immediate support is 1.0880 and below this level will open the gate to 1.0790.
- The Pound Sterling climbs above 1.2500 and hits a new YTD high at 1.2525, on risk on impulse in the FX space and overall US Dollar weakness. Economic data released in the US flashes the economy is slowing down, a headwind for the greenback. At the time of writing, the GBP/USD is trading at 1.2499, above its opening price by 0.72%.
- Wall Street reversed its course and turned red. The US JOLTs reports, sought by the US Federal Reserve (Fed) as they monitor labor market data, dropped to their lowest level in two years. Figures showed a decrease of 32K to 9.9 million job openings on the last day of February, its lowest since May 2021. Meanwhile, Factory Orders in the US fell for two consecutive months, printing a 0.7% MoM plunge, worse than an estimated contraction of 0.5%, according to the US Commerce Department.
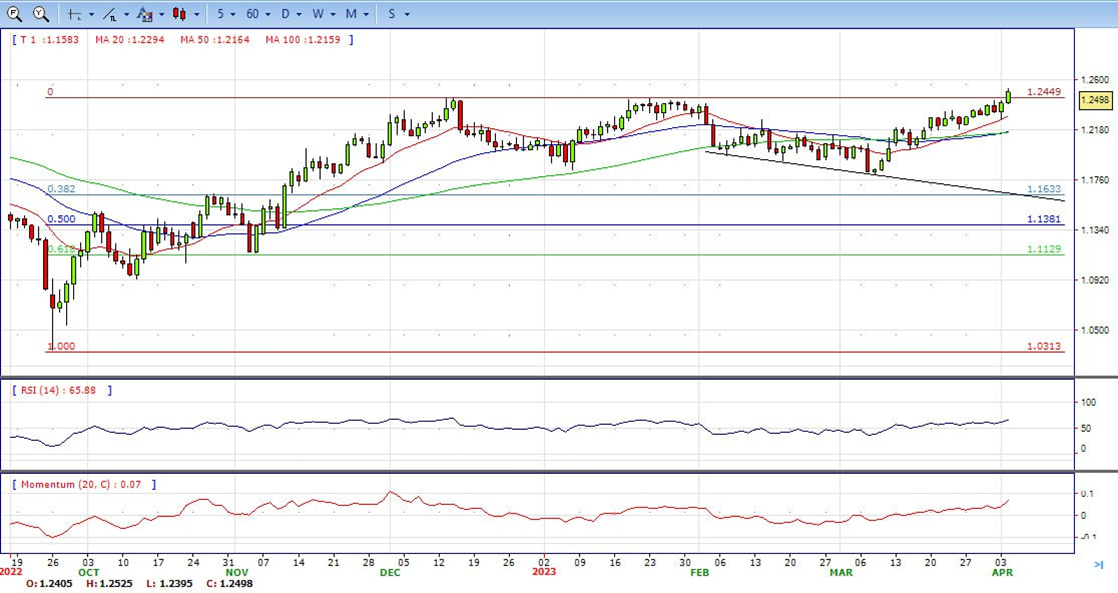
- The GBP/USD offers bullish stance in daily chart. Cable stabilizes above 20 and 50 SMA, indicating bullish strength in short term. Meanwhile, the 20 SMA continued accelerating north and heading towards longer ones, suggests bulls not exhausted yet. On upside, the immediate resistance is 1.2550 with a break above it exposing to 1.2660.
- Technical readings in the daily chart support the bullish stances. RSI indicator stabilizes around 66, while the Momentum indicator stabilizes above the midline, suggesting upward potentials. On downside, the immediate support is 1.2420, unable to defend this level will resume the decline to 1.2270.


- Gold price soared on Tuesday, jumped to high 2025 area for the first time since 2023. It stabilized above 2000 level and trades at 2021 at the end of US session, up around 1.84% for the day.
- Sentiment shifted sour as of late after a round of labor market data in the US has shown signs of cooling down. Job openings in February, reported in the JOLTs reports, dropped from 10.4 million to 9.931 million, a drop of 32,000. This could be a prelude that the labor market is cooling. Further data will be revealed during the week, with ADP Employment figures shown on Wednesday, followed by Initial Jobless Claims and the US Nonfarm Payrolls report. Of late, traders see a 57% probability of a Fed pause at the May 2-3 meeting vs. a 43% chance the day before. Investors forecast a 43% chance of a 25 bps rate hike while estimating two rate cuts by the year’s end.
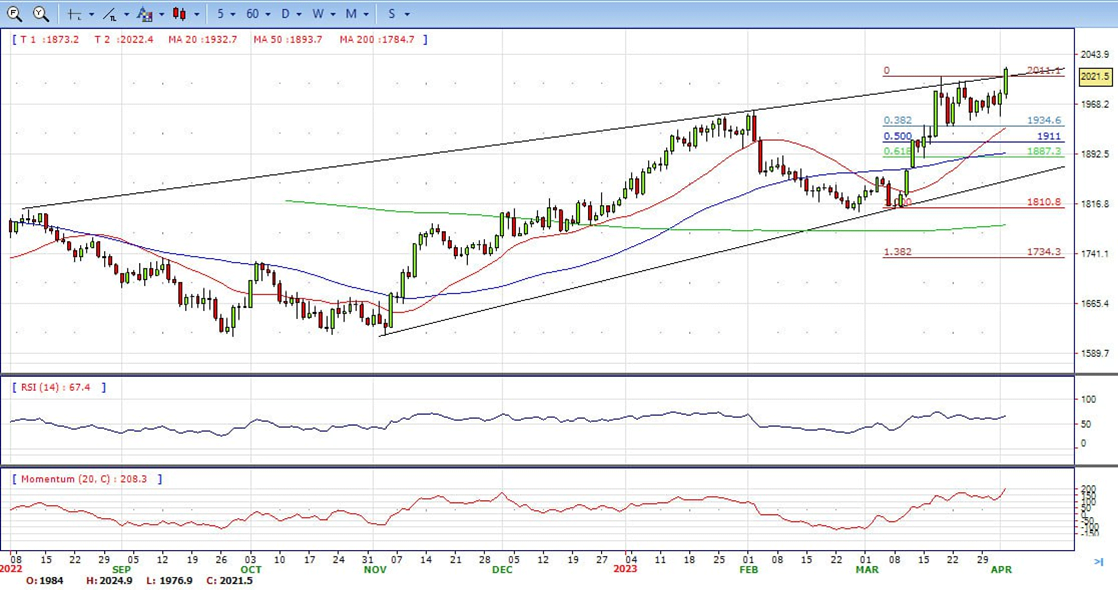
- Gold price stabilized around 2021, up for the day and bullish in the daily chart. The gold price still stabilizes above all main SMAs, suggesting bullish strength in short term. Meanwhile, the 20 continued accelerating north and continued developing far above 200 SMA, indicates bulls not exhausted yet. On upside, the immediate resistance is 2025, break above this level will open the gate for more advance to 2040 area.
- From a technical perspective, the RSI indicator holds above the mid-line and stabilizes around 68, on a bullish strength. The Momentum indicator hold in the positive territory, suggests upward potentials. On downside, the immediate support is 2000, below this area may resume the decline to 1976.


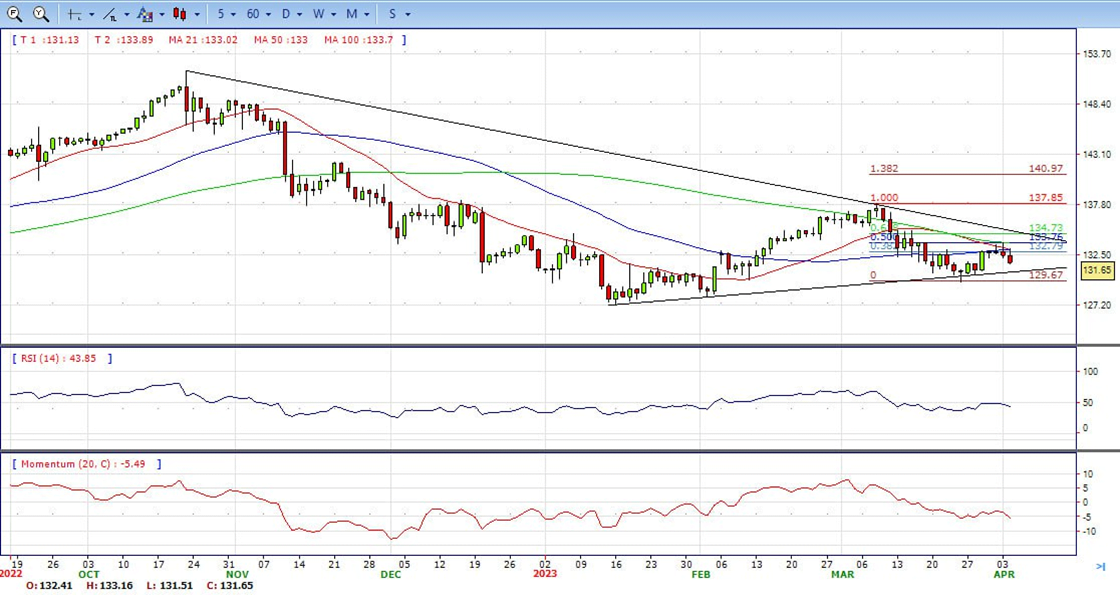
- The USD/JPY fell sharply after the release of US economic data pointed to a slowdown. The pair tumbled from 132.80 to 131.53, reaching the lowest since March 29. The pair remains under pressure under 131.80, with the US Dollar weaker across the board.
- The US Dollar struggles to capitalize on its intraday gains amid the uncertainty over the Fed’s rate-hike path, which turns out to be a key factor exerting some downward pressure on the USD/JPY pair. The downside, however, seems limited, at least for the time being, amid a generally positive risk tone, which tends to undermine the traditional safe-haven Japanese Yen. After the reports, US yields sank. The US 10-year yield dropped to 3.35% and the 2-year to 3.84%. The moves in the bond market boosted the Japanese currency which rose across the board.
- The USD/JPY pair stabilized around 131.65, down for the day and bearish in the daily chart. The price still stabilizes below 20 and 50 SMA, suggests bearish strength in short term. Meanwhile, 20 SMA continued accelerating south and heading towards 50 SMA, indicating bears not exhausted. On upside, overcome 132.20 may encourage bulls to challenge 133.80, break above that level will open the gate to 135.10.
- Technical indicators suggest the bearish strength. RSI stabilizes around 43, while the Momentum indicator stabilizes below the midline, suggests downward potentials. On downside, the immediate support is 131.50, break below this level will open the gate to 130.40 area.
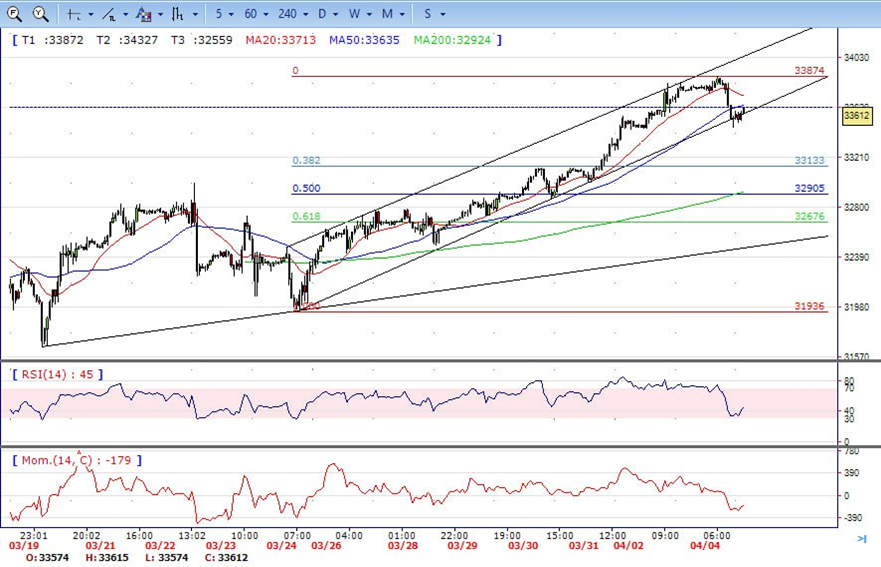
- DJI under the sell pressure after the release of US economic data, dropped from the intraday high 33876 area to intraday low 33455. It recovered modestly and ended Tuesday around 33610, down for the day and indicates bearish sign in the hourly chart. Right now market is standing below 20 and 50 SMA, suggests bullish strength. Meanwhile, 20 SMA started turning south and heading towards longer ones, suggests bears not exhausted yet. On upside, overcome 33880 may encourage bulls to challenge 34250, break above that level will open the gate to 34550.
- Technical indicators suggest the bearish movement. RSI stabilizes around 44, while the Momentum indicator stabilizes below the midline, suggests downward potentials. On downside, the immediately support is 33450, break below this level will open the gate for more decline to 33250 area.
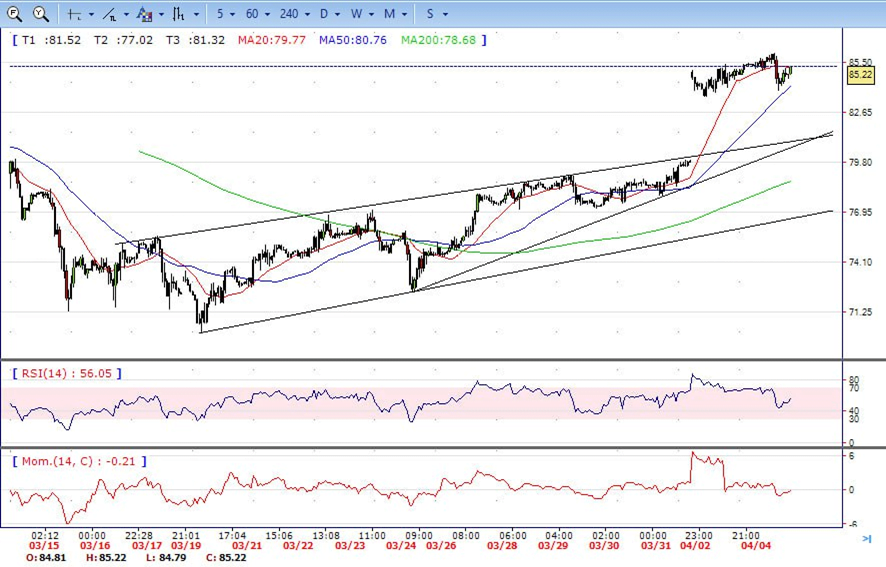
- Brent consolidated in the familiar range, traded between 83.80 low to 86.03 high. It holds near the top and ended Tuesday around 85.30, up for the day and indicates bullish sign in the hourly chart. Meanwhile, the 20 SMA continued accelerating north and developing far above 200 SMA, indicates bulls not exhausted yet. On upside, overcome 87.00 may encourage bulls to challenge 89.00, break above that level will open the gate to 91.00.
- Technical indicators also suggest bullish movement, hovering above the midline. RSI stabilizes at 57, while the Momentum indicator stabilizes in positive territory, suggests upward potentials. On downside, the immediately support is 83.50, break below this level will open the gate for more decline to 80.00 area.