

28/09/2022 Daily Reports
- The EUR/USD dropped further after the beginning of the American session and hit levels under 0.9600. It is hovering at 0.9590 to end Tuesday, bearish in the daily chart.
- Following the release of better-than-expected US Consumer Confidence data, the greenback started to recover from intraday losses across the board. The economic figures pushed US yields higher. The US 10-year yield climbed to 3.97%, hitting the highest since 2010.
- At the same time, stocks in the US trimmed gains. The Dow Jones pulled back more than 300 points, and is down by 0.07% while the S&P 500 rises by 0.08%. Stock indices continue to be unable to sustain a rebound suggesting that fear and concerns are still present among market participants, which favors the greenback as investors look for a safe haven.
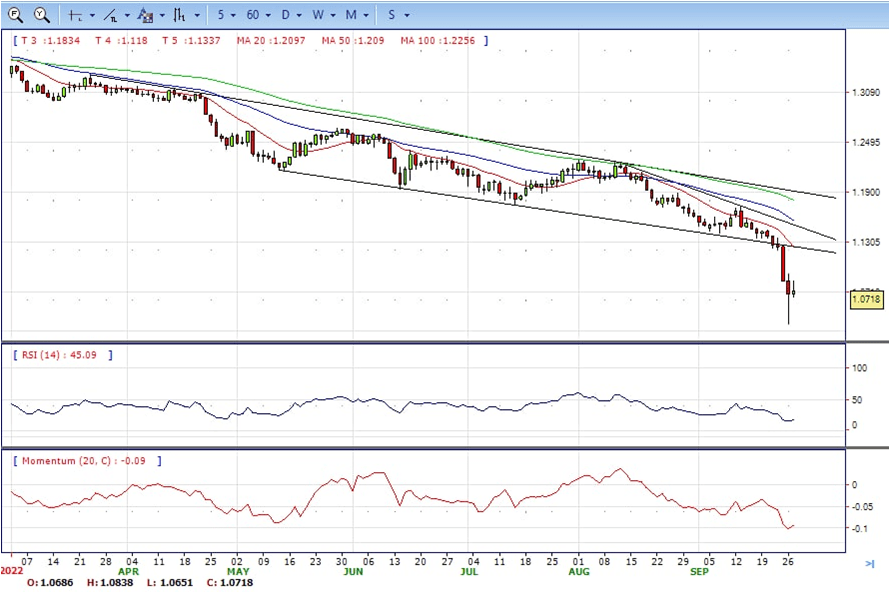
- The EUR/USD pair is trading near the 0.9590, down for the day with the bearish stance in daily chart. The pair stabilized below 20 and 50 SMA, indicates bearish strength in short term. Meanwhile, 20 SMA continued accelerating south and developing below longer ones, suggests bears not exhausted yet. On upside, the immediate resistance is 0.9710, break above this level will extend the advance to 0.9840.
- Technical readings in the daily chart support the bearish stances. The RSI indicators hovering below the midlines and stabilized around 26, shows bearish strength. The Momentum indicator stabilized below the midline, indicating downward potentials. On downside, the immediate support is 0.9550 and below this level will open the gate to 0.9500.

- The GBP/USD pair trims a part of its intraday gains and retreats to below 1.0700 during the North American session, though is still modestly up for the day and settled around 1.0730, still bearish in the daily chart.
- The new UK government’s mini-budget announcement last week as well as the plan to subsidise energy bills for households and businesses sparked concern about spiralling public debt. This is evident from a fresh slump in the UK fixed-income market, which pushes the 30-year yield to its highest level since 2007. Furthermore, the fiscal package is expected to fuel already high inflation and create additional economic headwinds, which, in turn, is seen as acting as a headwind for the British pound.
- That said, a modest US dollar weakness continues to lend support to the pair amid speculations that the BOE could intervene in the FX market to stabilise the domestic currency. The risk-on impulse, as depicted by the strong rally in the equity markets, turns out to be a key factor undermining the safe-haven greenback. That said, rising US Treasury bond yields, bolstered by expectations for a more aggressive policy tightening by the Fed limits any meaningful USD corrective pullback.
- The GBP/USD offers bearish stance in daily chart, it maintains the downward slope and now is stabilized below all main SMAs, indicating bearish strength. Meanwhile, the 20 SMA continued accelerating south and developing far below longer ones, suggesting bears not exhausted yet. On upside, The immediate resistance is 1.0840 with a break above it exposing to 1.0930.
- Technical readings in the daily chart support the bearish stances. RSI indicator stabilized around 19, while the Momentum indicator stabilized below the midline, suggesting downward potentials. On downside, the immediate support is 1.0630, unable to defend this level will resume the decline to 1.0450.

- Gold attracts some buyers near the $1,620 area and stages a goodish rebound from its lowest level since April 2020 touched earlier this Tuesday. It surged to high $1,642 area but failed to hold all the gains, ended Tuesday around 1629, still bearish in the daily chart.
- The US dollar continues its recent blowout rally and hold near a fresh two-decade high. This, in turn, is seen as a key factor offering pressure to the dollar-denominated gold. The USD bulls remain on the aggressive following the release of the rather unimpressive US Durable Goods Orders data for August.
- It is worth recalling that the yield on the rate-sensitive two-year US government bond rose to over a 15-year peak and the benchmark 10-year Treasury note to the highest level since April 2010 on Monday. This supports prospects for the emergence of some USD dip-buying. Apart from this, the risk-on impulse might further contribute to keeping a lid on any meaningful upside for the non-yielding gold.
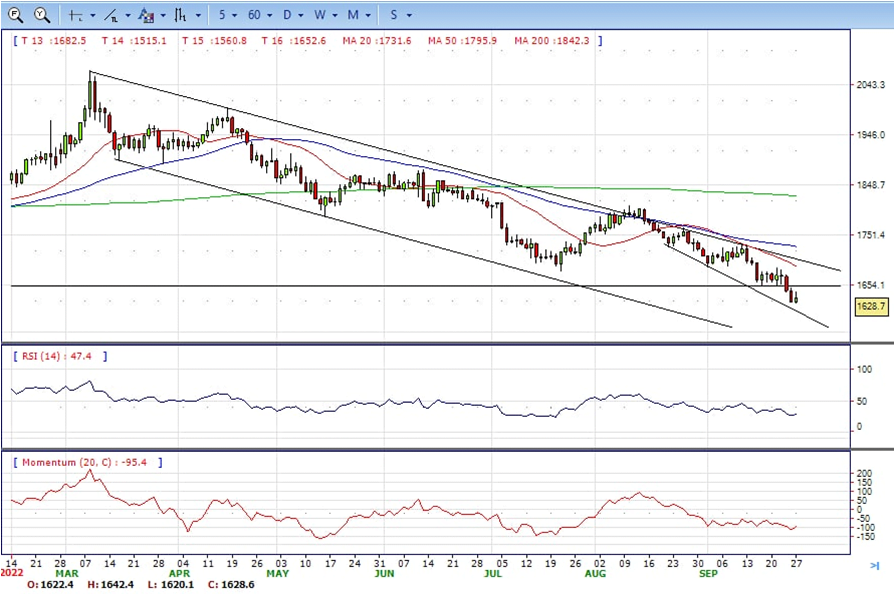
- Gold price stabilized around 1629, up for the day and bearish in the daily chart. The gold price stabilized below all main SMAs, suggesting bearish strength in short term. Meanwhile, the 20 SMA continued accelerating south and developing below longer ones, indicating bears not exhausted yet. On upside, the immediate resistance is 1642, break above this level will open the gate to extend the advance to 1674 area.
- From a technical perspective, the RSI indicator hold below the midline and stabilized around 29, suggesting bearish strength. The Momentum indicator struggled below the midline, suggests bearish potentials. On downside, the immediate support is 1620, below this area may resume the decline to 1600 psychological level.


- The USD/JPY pair struggles to capitalize on its gains recorded over the past two trading sessions and meets with some supply on Tuesday. The pair remains on the aggressive through the US session and is currently trading around the 144.85 area, still bullish in the daily chart.
- Despite the Japanese government’s intervention in the FX market, a big divergence in the monetary policy stance adopted by the Bank of Japan continues to weigh on the Japanese yen. Adding to this, the risk-on impulse, as depicted by a positive tone around the equity markets, further undermines the safe-haven JPY.
- Tuesday’s US economic docket features the release of Durable Goods Orders, the Conference Board’s Consumer Confidence Index, New Home Sales and the Richmond Manufacturing Index. This, along with the US bond yields, will influence the USD price dynamics. Traders will further take cues from the broader risk sentiment to grab short-term opportunities around the USD/JPY pair.
- The USD/JPY pair stabilized around 144.85, up for the day and bullish in the daily chart. The price still maintains the upward slope and stabilized above all main SMAs, suggests bullish strength. Meanwhile, 20 SMA continued accelerating north and developing above longer ones, indicating bulls not exhausted in the long term. On upside, overcome 145.00 may encourage bulls to challenge 146.00, break above that level will open the gate to 147.00.
- Technical indicators suggest the bullish strength. RSI stabilized around 65, while the Momentum indicator continued developing above the midline, suggests upward potentials. On downside, the immediate support is 143.00, break below this level will open the gate to 140.30 area.


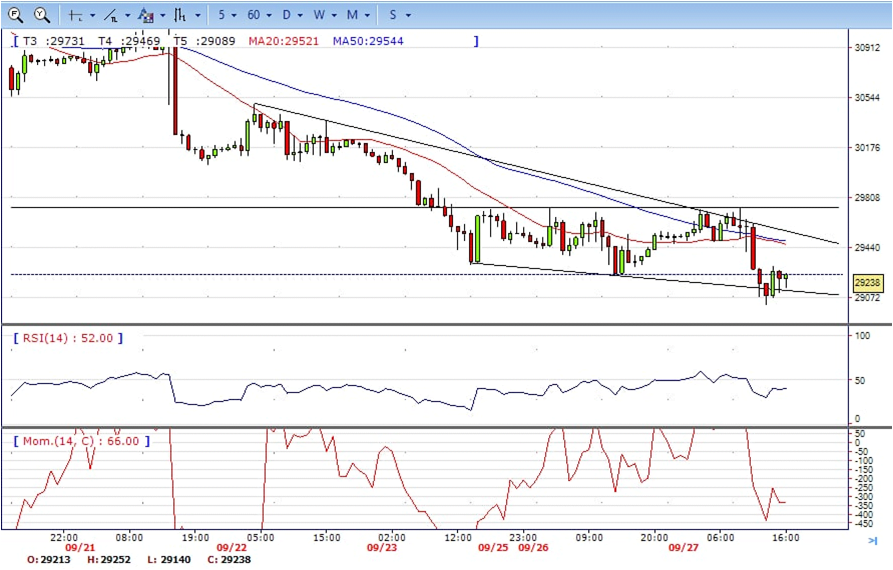
- DJI still under the sell pressure, It tumbled to intraday low 29018 area, then trimmed some losses and ended Monday around 29230, still bearish in the hourly chart. It stabilized below 20 and 50 SMA, suggests bearish strength. Meanwhile, the 20 SMA continued accelerating south and developing below longer ones, suggesting bears not exhausted yet. On upside, overcome 29310 may encourage bulls to challenge 29470, break above this level will open the gate to 29740.
- Technical indicators suggest the bearish strength, developing below the midline. RSI stabilized around 40, while the Momentum indicator stabilized in negative territory, suggests downward potentials. On downside, the immediate support is 29000, break below this level will open the gate for more decline to 28800 area.
- Brent made some advance after hit 83.60 area on Tuesday, It climbed to 87.10 area, then retreated modestly and ended Tuesday around 85.90, neutral to bullish in the hourly chart. The price stabilized above 20 and 50 SMAs, suggests bullish strength in short term. Meanwhile, the 20 SMA started accelerating north and heading towards longer ones, indicating bulls not exhausted yet. On upside, overcome 87.70 may encourage bulls to challenge 89.00, break above this level will open the gate to 91.00.
- Technical indicators suggest the neutral to bullish movement, hovering above the midline. RSI stabilized around 52, while the Momentum indicator continued developing above the midline, suggests upward potentials. On downside, the immediate support is 85.00, break below this level will open the gate for more decline to 82.40 area.


